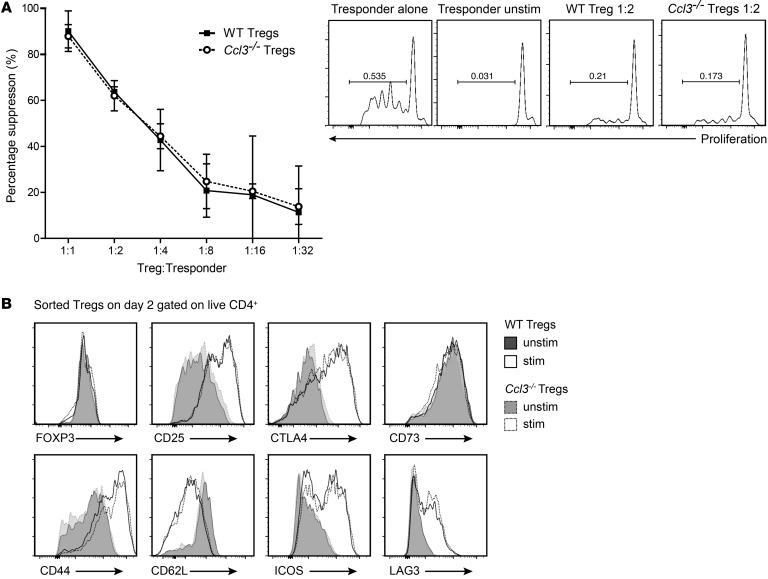
Figure 3. WT and Ccl3–/– Tregs suppress T cell proliferation equally and have an equivalent activation phenotype.
(A) CD4+CD25hiCD45RBlo Tregs from WT or Ccl3–/– mice were added in increasing numbers to CPD-labeled WT CD4+CD25–CD45RBhi Tconv cells. The cocultures were stimulated with α-CD3 mAbs and irradiated APCs for 3 days. Tconv cell proliferation was measured by CPD dilution, and division index was calculated and used to determine percentage of suppression (n = 3). (B) WT or Ccl3–/– Tregs were cultured with or without stimulation with α-CD3/28 and IL-2 as in Figure 2. After 2 days, the expression of the indicated proteins was determined by flow cytometry. Shown are histogram overlays representing data from Tregs pooled from 5 WT or Ccl3–/– mice analyzed with technical replicates of at least 2 independent experiments.

