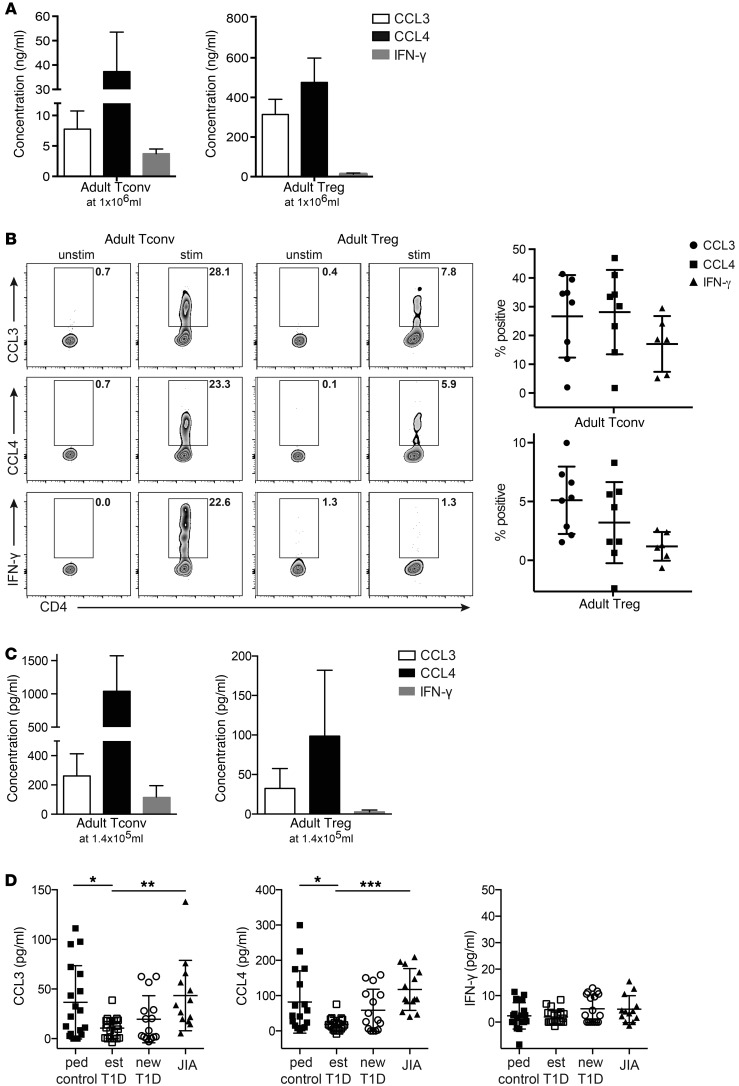
Figure 7. Tregs from the blood of subjects with established T1D have decreased CCL3 and CCL4 production.
(A) Tregs and Tconv cells were sorted from the blood of healthy adults, and 1 × 10⁶/ml were stimulated with α-CD3/α-CD28–coated beads in the presence of IL-2. After 48 hours, the amounts of CCL3, CCL4, and IFN-γ in supernatants were determined. The background of the respective unstimulated samples was subtracted; shown are the means ± SEM for 3 individuals. (B) Activated Tregs and Tconv cells were restimulated with PMA/ionomycin, and the proportions of live, single cells producing CCL3, CCL4, or IFN-γ were determined. Shown are representative plots and mean ± SEM for 8 individuals with the background of the respective unstimulated sample subtracted. (C) FACS-sorted peripheral blood Tconv cells and Tregs from adult controls (n = 15, mean with SD) were activated with α-CD3/α-CD28–coated beads in the presence of IL-2 for 48 hours at a cell concentration of 1.4 × 10⁵/ml (left panel) or 1.4 × 10⁵/ml (right panel). FACS-sorted peripheral blood Tregs from pediatric controls (n = 17–18), established T1D (est) (n = 18–22), new-onset T1D (new) (n = 15–17), and JIA (n = 13) patients were activated with α-CD3/α-CD28–coated beads in the presence of IL-2 for 48 hours at a cell concentration of 1.4 × 10⁵/ml. For C and D, supernatants were collected and CCL3, CCL4, and IFN-γ were assessed by CBA. Background measurements in the unstimulated sample were subtracted, and outliers were excluded by the ROUT method (Q = 1%); 1-way ANOVA with Bonferroni’s post-hoc test. *P < 0.05; **P < 0.01; ***P < 0.001.

