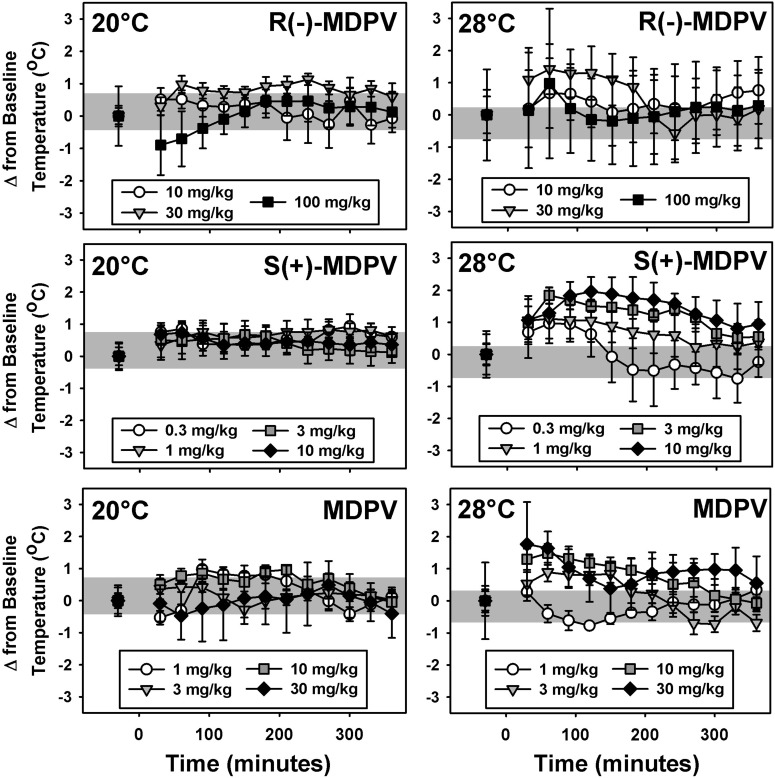
Fig. 4.
Thermoregulatory effects of R(−)-MDPV (top), S(+)-MDPV (middle), and MDPV (bottom) at an ambient temperature of 20°C (left) or 28°C (right) in mice. On the abscissae, points to the left of the 0 denote baseline data before injection, presented as the mean change in temperature observed over 30 minutes. Numbers refer to time, in minutes, after MDPV administration. Ordinates indicate the mean change in core temperature from baseline values in degrees Celsius. Gray regions represent the range of temperature fluctuation observed over 6 hours after saline injection. Errors bars depict means ± S.E.M.

