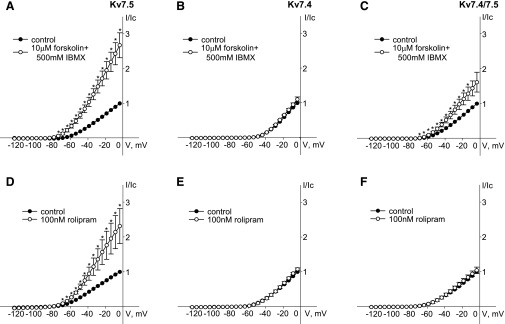
Fig. 5.
Differential regulation of hKv7.5, hKv7.4, and hKv7.4/7.5 by forskolin/IBMX and rolipram. (A and D) Current-voltage (I-V) curves of steady-state Kv currents recorded in A7r5 cells overexpressing hKv7.5 before (control, solid circles) and after 5 minutes of treatment with 10 μM forskolin in the presence of 500 μM IBMX (A, open circles, n = 7) or 100 nM rolipram (D, open circles, n = 7). (B and E) I-V curves of steady-state Kv currents recorded in A7r5 cells overexpressing hKv7.4 before (control, solid circles) and after 5 minutes of treatment with 10 μM forskolin in the presence of 500 μM IBMX (B, open circles, n = 3) or 100 nM rolipram (E, open circles, n = 5). (C and F) I-V curves of steady-state Kv currents recorded in A7r5 cells overexpressing hKv7.4/7.5 before (control, solid circles) and after 5 minutes of treatment with 10 μM forskolin in the presence of 500 μM IBMX (C, open circles, n = 6) or 100 nM rolipram (F, open circles, n = 5). The asterisks (*) indicate significant difference from control, P < 0.05, paired Student’s t test.

