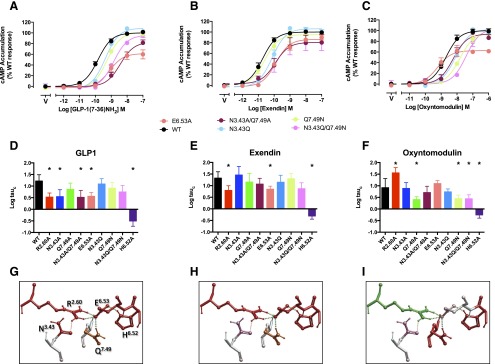
Fig. 3.
Effect of mutation of the central polar network on peptide-mediated cAMP production. Upper panels (A–C) illustrate concentration-response curves for each of the peptides at the wild-type and mutant receptors with data fitted to the operational model. For clarity, only data from new mutants, or those not quantified previously, are displayed. Middle panels (D–F) illustrate affinity-independent measures of efficacy (Log tau) determined by operational modeling of the data, corrected for receptor Bmax at the cell surface: (A, D) GLP-1-mediated responses, (B, E) exendin-4-mediated responses, (C, F) oxyntomodulin-mediated responses. Data are displayed as mean ± S.E.M. of four to six independent experiments, conducted in duplicate. *Significantly different from wild-type receptor at P < 0.05, analysis of variance with Dunnett’s post-test. V, vehicle. Data for expression of the previously published R2.60190A, N3.43240A, Q7.49394A, and H6.52363 receptor mutants (Wootten et al., 2013b) is included for comparison. (G–I) Molecular models (x-stick format) illustrating the predicted central interaction network and their impact on peptide-mediated cAMP formation: (G) GLP-1, (H) exendin-4, (I) oxyntomodulin. Amino acids negatively impacted by mutation are colored red, those positively impacted in green, while those unaffected are colored by side-chain as in Fig. 1E. Predicted H-bonds are displayed as dotted lines.

