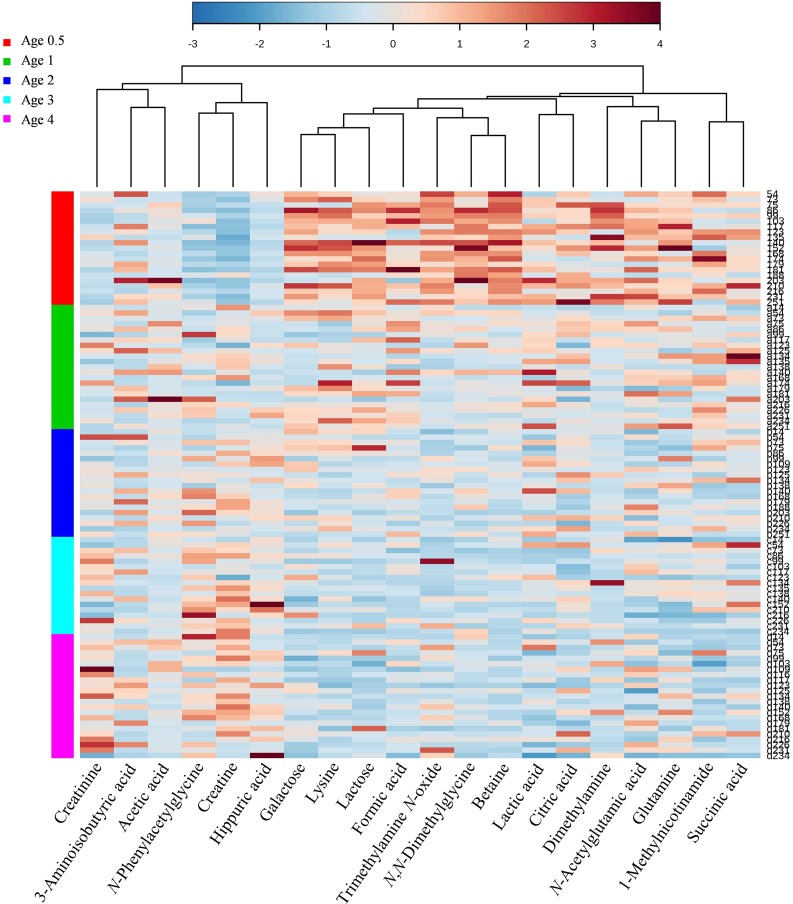
Fig 1. Heat map of 20 metabolites selected by the PLS-DA VIP score > 1.5 across 6 months to 4 years of age.
Each row represents a urine sample and each column represents the expression profile of a metabolite across age groups. The changes of x-fold standard deviation from the overall mean concentration for different years of age are shown in a color-coded way. Blue color represents a decrease, and red color an increase. PLS-DA, partial least squares-discriminant analysis; VIP, Variable Importance in Projection.

