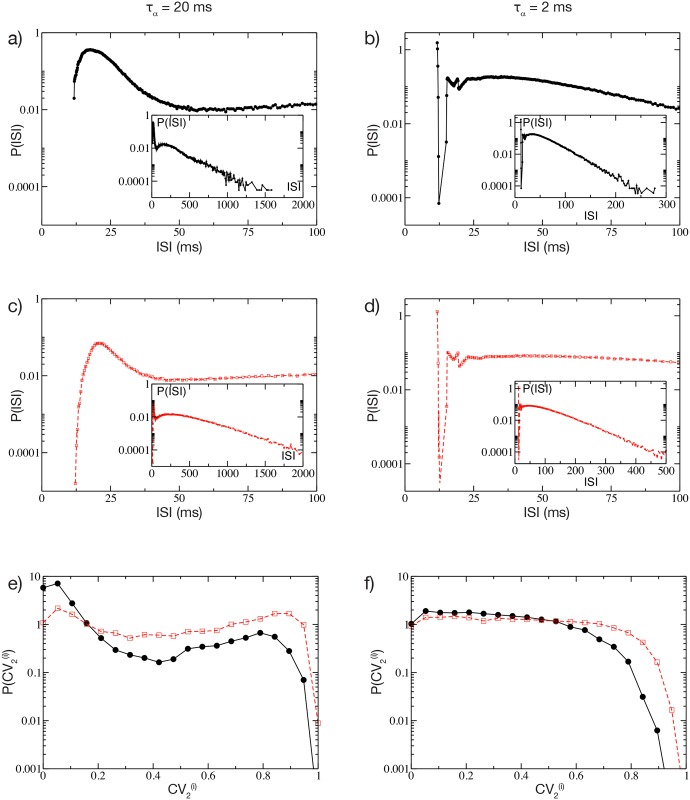
Fig 4. Single neuron statistics.
a) Distribution P(ISI) at short values of ISIs for one representative cell in the network, by setting τα = 20 ms. Inset: same as main figure for the whole range of ISIs. b) Same as a) for τα = 2 ms. c-d) Corresponding Poissonian reconstruction of the P(ISI) for the same cases depicted in a) and b). e-f) Single neuron distribution of the for the same considered cases as in a) and b) calculated from the simulation (black solid lines with circles) and the Poissonian reconstruction (red dashed line with squares). The network parameters are ΔV = 5 mV and g = 8, remaining parameters as in Fig 1. Both the examined neurons have Is = −45.64 mV. For the Poissonian reconstruction the frequencies of the incoming uncorrelated spike trains are set to 〈ν〉N ≈ 7.4 Hz (〈ν〉N ≈ 8.3 Hz) for τα = 20ms (τα = 2ms), as measured from the corresponding network dynamics. The distributions are obtained by considering a sequence of 109 spikes in the original network, and 107 events for the Poissonian reconstruction.

