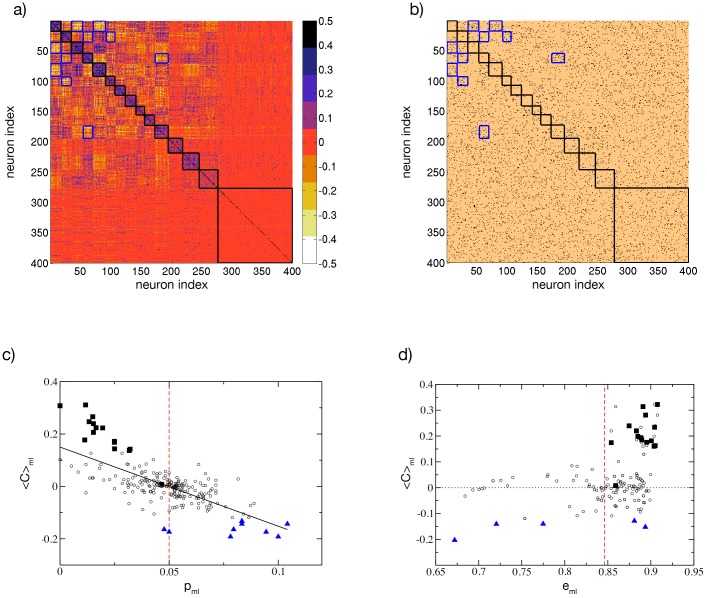
Fig 5. Cell assemblies and connectivity.
a) Cross-correlation matrix C(νi, νj) of the firing rates organized according to the clusters generated via the k-means algorithm with k = 15, the clusters are ordered as in Fig 1(c) from the highest to the lowest correlated one. b) Connectivity matrix with the indices ordered as in panel a). Here, a black (copper) dot denotes a 1 (0) in , i.e. the presence(absence) of a synaptic connection from j to i. c) Average cross-correlation 〈C〉ml among the elements of the matrix block (m, l), versus the probability pml to have synaptic connections from neurons in the cluster l to neurons in the cluster m. d) 〈C〉ml versus the block averaged similarity metrics eml. Black squares indicate the blocks along the diagonal delimited by black borders in panel a) and b); blue triangles denote the ten blocks with the lowest 〈C〉ml values, which are also delimited by blue edges in a) and b). The vertical red dashed line in panel c) denotes the average probability to have a connection p = 5% and in panel d) the value of the metrics eml averaged over all the blocks. The black solid line in panel c) is the linear regression to the data (〈C〉ml ≈ 0.15–3.02pml, correlation coefficient R = −0.72). Other parameters as in Fig 1.

