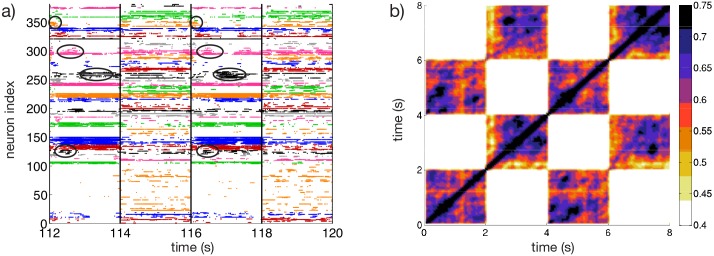
Fig 6. Sequential switching.
a) Raster plot associated to the two input protocols I(1) and I(2). The circles denote the clusters of active neurons appearing repetitively after the presentation of the stimulus I(1). Vertical lines denote the switching times between stimuli. The clustering algorithm employed to identify the different groups is applied only during the presentation of the stimulus I(1), therefore the sequential dynamics is most evident for that particular stimulus. b) Averaged State Transition Matrix , obtained by considering a 4Tsw × 4Tsw sub-matrix averaged over r = 5 subsequent time windows of duration 4Tsw (see the section Methods for details). The inputs I(1) and I(2) are different realization of the same random process, they are obtained by selecting N current values Ii from the flat interval [Vth, Vth + ΔV]. The input stimuli are switched every Tsw = 2 s. Number of clusters k = 35 in a). Other parameters as in Fig 1.

