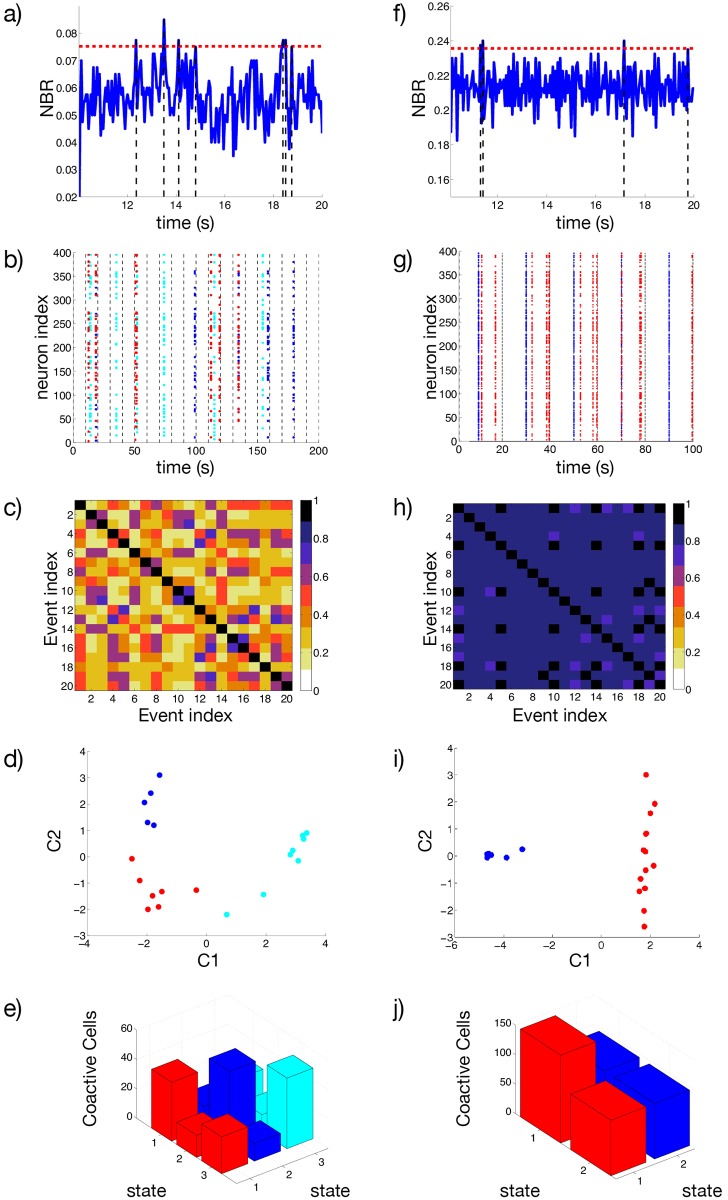
Fig 9. Response of the network to an increase in the excitability.
a,f) Network Bursting Rate, and the threshold defined for considering a synchronized event. b,g) Neurons involved in the synchronized events, vertical lines denoted the switching times between the excited I(e) and control I(c) inputs. Colors in the raster indicates the group assigned to the synchronous event using an optimal community partition algorithm. c,h) Synchronized Event Transition Matrix, calculated with a window TW = 50 ms and number of events Ss = 20. d,i) Projection of the synchronized events in the 2D space spanned by the first two principal components associated to the covariance matrix of the vectors Ws. e,j) Number of coactive cells in each state. The diagonal elements of the bar graph represents the total number of neurons contributing to one state. Panels (a-e) correspond to g = 8, while panels (f-j) depict the case g = 1. In both cases the system is recorded during the time span required to identify Ss = 20. Remaining parameters as in Fig 1.

