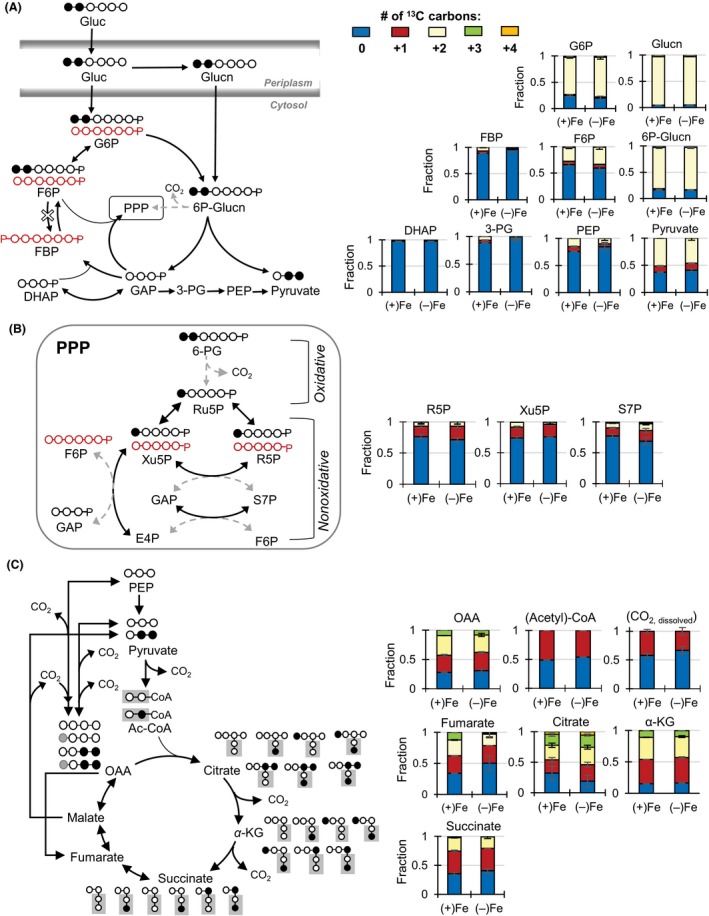
Figure 2.

Elucidating the metabolic network structure through the assimilation of [1,2‐13C2]‐glucose into intracellular metabolites. (A) Carbon mapping (left) and metabolite labeling (right) in the periplasm, the Embden–Meyerhof–Parnas (EMP), and the Entner–Doudoroff (ED) pathways. The red‐colored arrows and carbon skeletons are to illustrate the formation of nonlabeled metabolites that are directly a result of the ED pathway into the reverse route of the EMP pathway. (B) Carbon mapping (left) and metabolite labeling (right) in the pentose‐phosphate pathway (PPP). (C) Carbon mapping (left) and metabolite labeling (right) in the tricarboxylic acid cycle (C). The broken‐lined arrows indicate the minor formation routes of the metabolites. Labeling patterns: nonlabeled (blue), singly labeled (red), doubly labeled (yellow), and triply labeled (green). Legend for metabolite names are the same as reported in Figure 1. Isotopologue data (average ± standard deviation) were obtained from four biological replicates. [Correction added on 30 September 2015 after first online publication: Figure 2 had inconsistent labelling and these have now been corrected in this version].
