Figure 3.

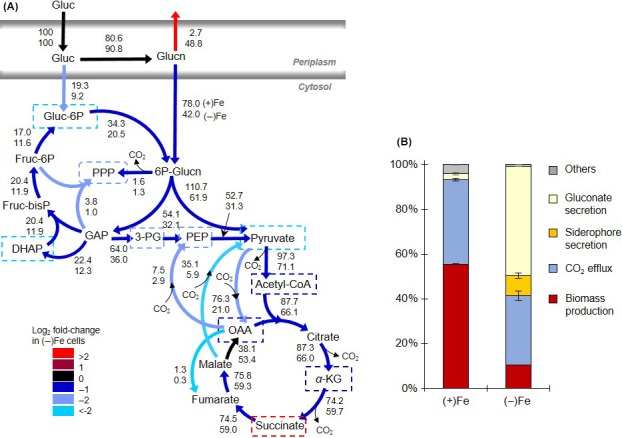
Quantitative metabolic flux analysis. (A) Metabolic flux modeling constrained by 13C metabolite labeling, metabolite secretion, siderophore secretion, and biomass composition. The top and bottom numbers represent, respectively, the metabolic reaction rates normalized to glucose uptake in Fe‐replete [(+)Fe] and the Fe‐limited [(−)Fe] Pseudomonas putida cells. Metabolites outlined with broken‐lined squares contribute to biomass and siderophore biosynthesis. The different colors reflect the log2 fold‐change of the reaction rates in the (−)Fe cells compared to those in (+)Fe cells. Statistics on the estimated reaction rates are presented in Table S3 and S4. (B) Percentage investment of the total glucose consumption rate toward gluconate secretion (yellow), siderophore secretion as pyoverdine (orange), net carbon dioxide efflux generated from metabolic reactions (blue), and biomass production (biosynthesis of amino acids, ribonucleotides, and cell membrane components) (dark red). Others denote the sum of other metabolite excretions. The values were estimated from the experimentally constrained metabolic flux analysis (illustrated in part A) on P. putida cells exponentially growing under (+)Fe and (−)Fe conditions. [Correction added on 2 December 2015, after first online publication: Some of the values in Figure 3 were incorrect and have now been amended in this current version and in Table S4 in the Supporting Information.]
