Figure 9.

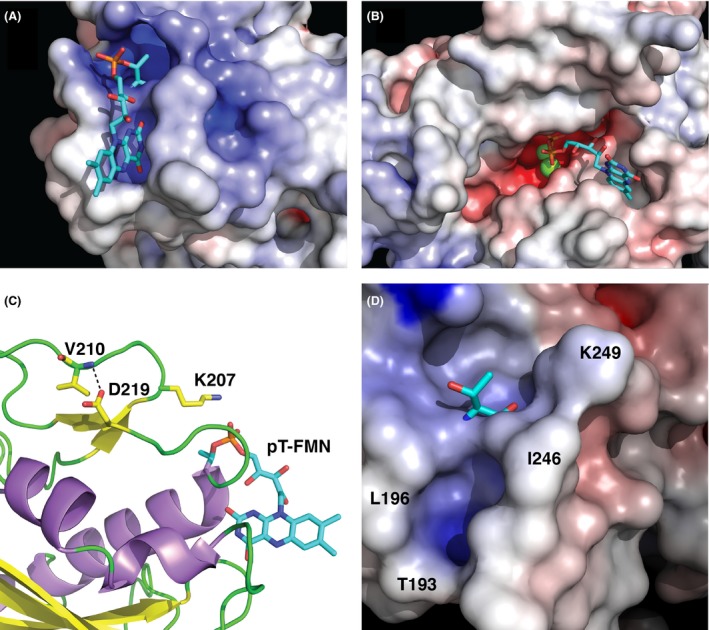
FMN binding site analysis. Zoomed‐in view of surface representations illustrating the electrostatic potential of (A) the NqrC_So flavinylation target site and (B) the Ftp_Tp active site (Deka et al. 2013a). Shown in stick representations are the phosphoester‐threonyl‐FMN residue in NqrC_So and the bound FAD in Ftp_Tp, and Mg2+ ions are shown as green spheres. (C) Shown with yellow carbon atoms in stick representation are residues that participate in the hydrogen bond between the side chain of the highly conserved D219 and the main chain amide in the loop that caps the phosphoester‐threonyl‐FMN binding site. Also shown in this format is the side chain of the conserved K207 residue. (D) Zoomed‐in view of a surface representation illustrating the electrostatic potential of the NqrC_Pd flavinylation target site. Shown in stick representation is T245, and selected residues that line the FMN binding cleft are labeled.
