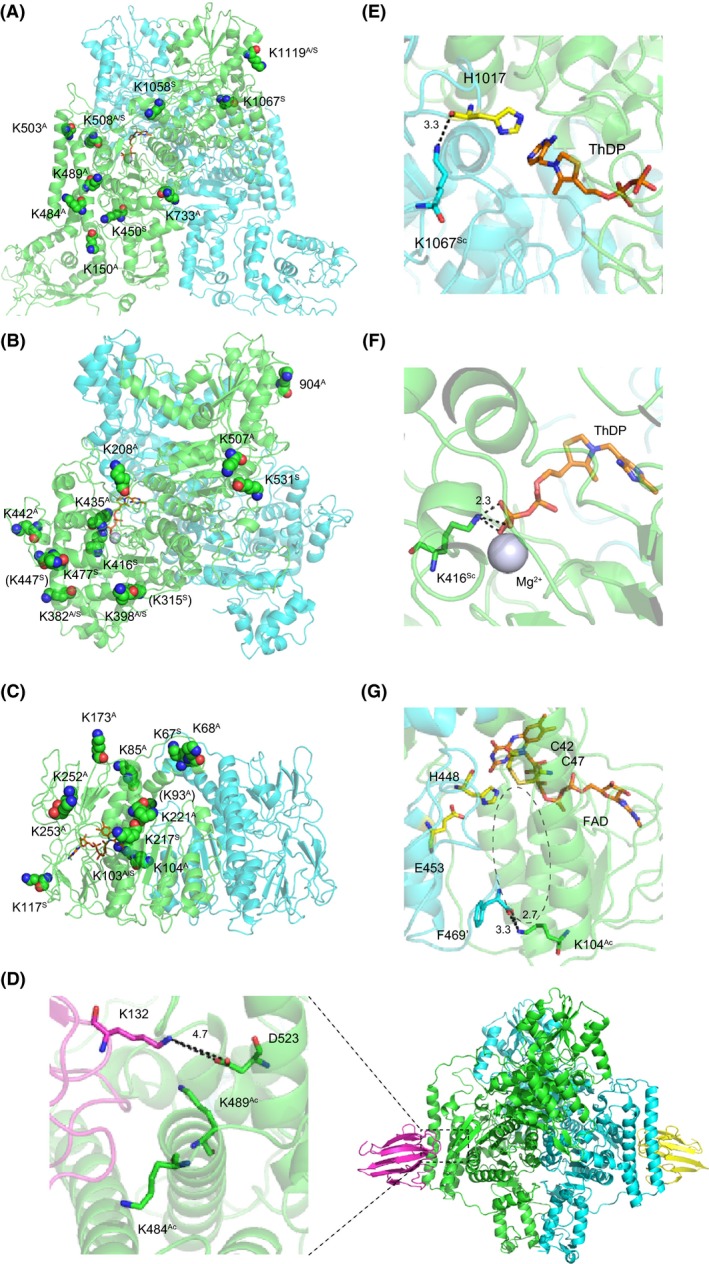
Figure 6.

Schematic presentation of the location of acyl modification sites in components of the 2‐oxoglutarate dehydrogenase complex (ODHC) and PDHC. The positions of acyl modification sites of CgKgd (E1o) (A), CgAceF (E1p) (B), and CgLpd (E3) (C) are shown. The structural models were constructed based on the structures of MsKgd (PDB 2XT6) (T. Wagner et al. 2011), EcAceF (PDB 2IEA) (Arjunan et al. 2002), and MtLpd (PDB 2A8X) (Rajashankar et al. 2005). They are homodimeric and different protomers are shown with green and cyan chains. Lysine residues susceptible to acyl modification are shown with sphere: red and blue spheres represent oxygen and nitrogen atoms, respectively. Cofactors (ThDP and FAD) are indicated with orange stick. (D) The position of acyl‐modification sites located in the interface of CgKgd (green) and OdhI (magenta). The structural model of the CgKgd/OdhI complex was constructed based on the structure of the MsKgd/GarA complex (PDB 2XT9). (E) The position of the K1067 succinylation site (cyan stick) of CgKgd (E1o). H1017, which is involved in thiamine diphosphate. (ThDP) binding, is shown with a yellow stick. The image was extracted from Fig. 6A. (F) The position of the K416 succinylation site (green stick) is shown. The image was extracted from Fig. 6B. Magnesium ion is shown with gray sphere. (G) The position of the K104 acetylation site (green stick) is shown. A dotted‐line circle represents a channel where the lipoylated side chain of E2 accesses the catalytic sites (yellow). The image was extracted from Fig. 6C.
