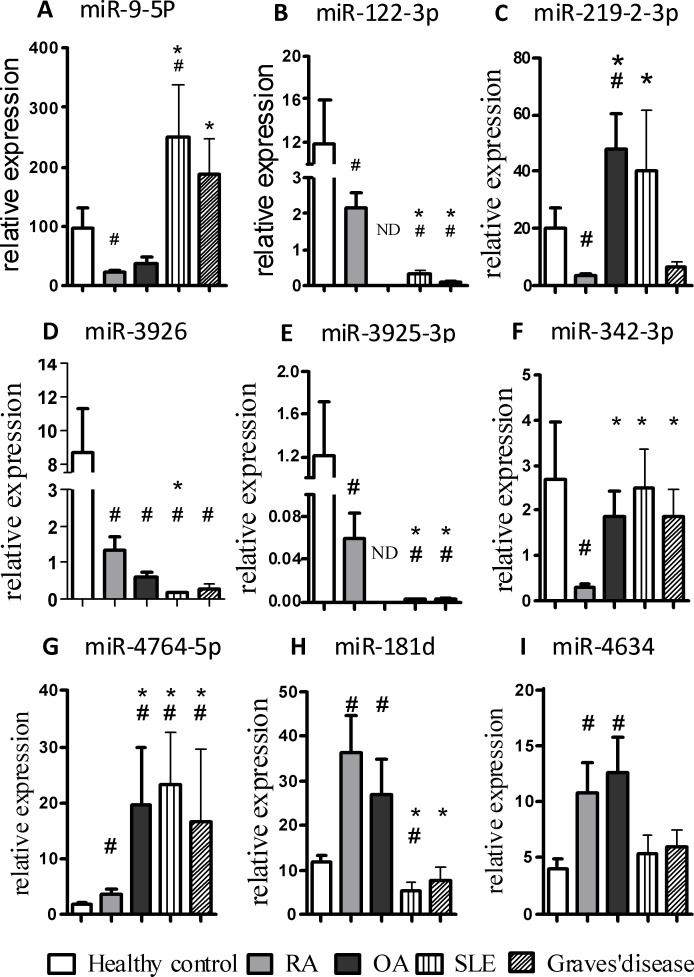
Figure 4. Evaluation of the validated 9 miRNAs for the discrimination of RA patients from disease controls.
The expression of 9 validated miRNAs in the plasma obtained from patients with RA (n = 75), OA (n = 18), SLE (n = 21), Graves' disease (n = 14) and HCs (n = 70) was determined by qRT-PCR. The bars denote the mean 2−Δcq values ± SD (*, P-values < 0.05 versus RA; #, P-values < 0.05 versus HC. ND, None detected.)

