
Figure 2. 2CP inhibits PDPN-mediated TCIPA.
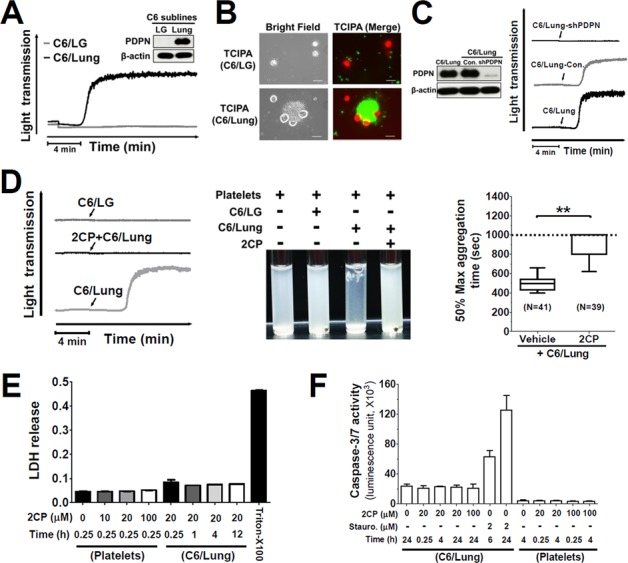
A. The expression of PDPN proteins in the indicated cell lines was determined by Western blotting using the anti-PDPN antibody (inserted panel). The expression of β-actin was used for the control of equal protein loading. The cells (1.5 × 10⁶) from the indicated cell lines were added to the human washed platelet suspension (1 × 10⁹/ml) to stimulate platelet aggregation. Tumor cell-induced platelet aggregation was measured and recorded by using an aggregometer. Representative traces of platelet aggregation are shown. B. Calcein-AM green-labeled platelets (1 × 10⁹/ml, green) were incubated with the calcein-AM orange/red-labeled cells (1.5 × 10⁶, red) in an aggregometer. The reaction mixtures were then placed on a glass slide for fluorescence microscopy analysis. Representative fluorescent images are shown to demonstrate the interaction between tumor cells and platelets. Scale bar = 20 μm. C. The expression of PDPN protein in the indicated cell lines was determined by Western blotting using the anti-PDPN antibody (left panel). The expression of β-actin was used for the control of equal protein loading. The platelet aggregation-inducing activities of these sublines were evaluated by TCIPA assays. Representative traces of platelet aggregation are shown (right panel). Arrows indicate the point of cells being added. D. The cells from the indicated cell lines were added into the washed platelets with or without pre-incubation with 2CP (20 μM). Representative traces of platelet aggregation (left panel) and the turbidity of the reactions (center panel) are shown. The time to reach 50% of the maximal aggregation was defined as the aggregation time that is shown as Box with whiskers (Min to Max) plot (right panel). The value is set to 1000 sec when no platelet aggregation was observed. **P < 0.01 when compared with the vehicle treatment. E–F. Platelets and C6/Lung cells were treated with the indicated concentrations of 2CP and the LDH and caspase 3/7 activities were measured. The data represent the mean ± S.E of three to six independent experiments.