
Figure 1. Box plot showing the distribution of γ-H2AX values in pre and post-neoadjuvant chemotherapy samples.
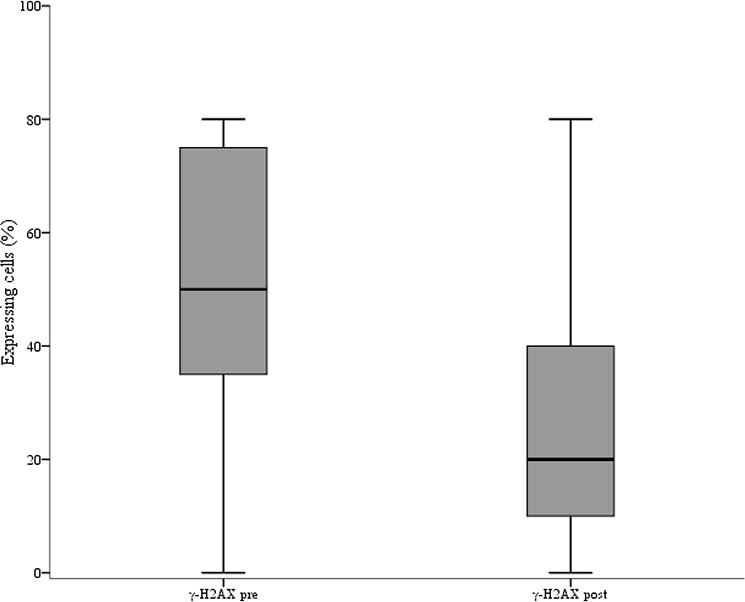
The figure shows the median values (horizontal bars within boxes), 25th and 75th percentile (lower and upper horizontal lines of the boxes), and minimum and maximum values (lower and upper horizontal bars outside the boxes).