
Figure 5. Representative histopathological appearance and immunohistochemical analysis of phosphorylated GSK3βSer9 in the pancreas of BOP-treated hamster.
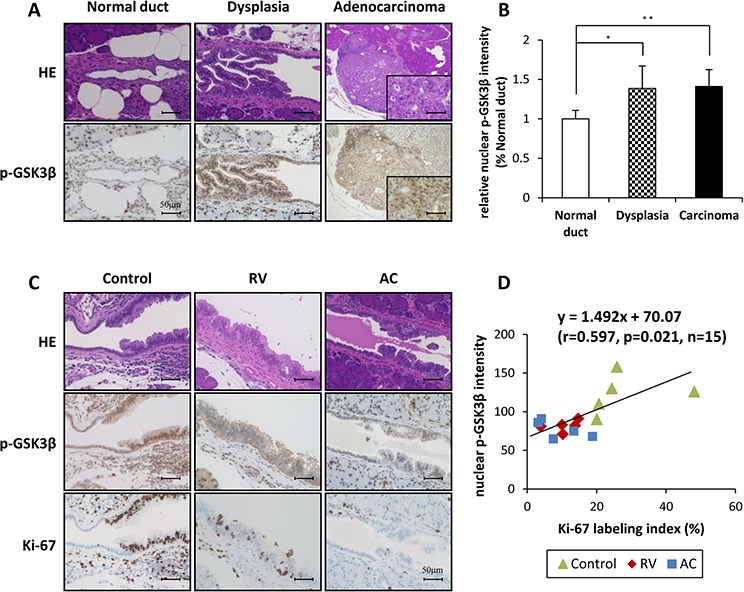
A. and B. Comparison of staining for nuclear phosphorylated GSK3βSer9 between normal duct, dysplasia and adenocarcinoma of the control group of BOP-treated hamsters. Bars = 50 μm. The intensity score of nuclear phosphorylated GSK3βSer9 in each group, *P < 0.05 and **P < 0.01 as compared to normal duct. C. and D. The staining for nuclear phosphorylated GSK3βSer9 in dysplasia of RV- and AC-treated hamsters was lower than that in the control group. Calculation of the regression line based on the relationship between nuclear phosphorylated GSK3βSer9 and Ki-67 labeling index by Pearson's correlation (r = 0.597, p = 0.021, n = 15).