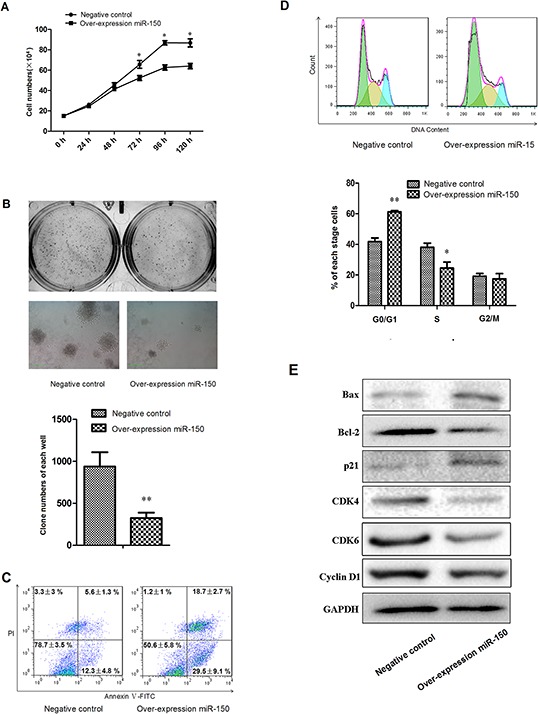
Figure 5. miR-150 suppresses the proliferation of K562 cells.

A. Growth curve of K562 cells stably transfected with pre-miR-150 expression plasmid or negative control plasmid and induced with hemin for 0, 24, 48, 72, 96 and 120 hours. B. Representative images and statistics of Soft agar colony formation assay: colony formation was observed and counted in each well of 6-well plate. The left images represent clones formed from control cells, and the right images represent results from cells overexpressing miR-150. C. Representative flow cytometry plots with data label of cells assayed with Annexin V and PI. D. Representative flow cytometry profiles of cell cycle with statistics shown below. E. Western blot analyses of key molecules involved in apoptosis and cell cycle regulation, including Bcl-2, Bax, p21, CDK4, CDK6 and CyclinD1. GAPDH was used as the housekeeping gene. All data represent mean ± SD (n = 3). *P < 0.05 for each paired condition with and without miR-150 overexpression.
