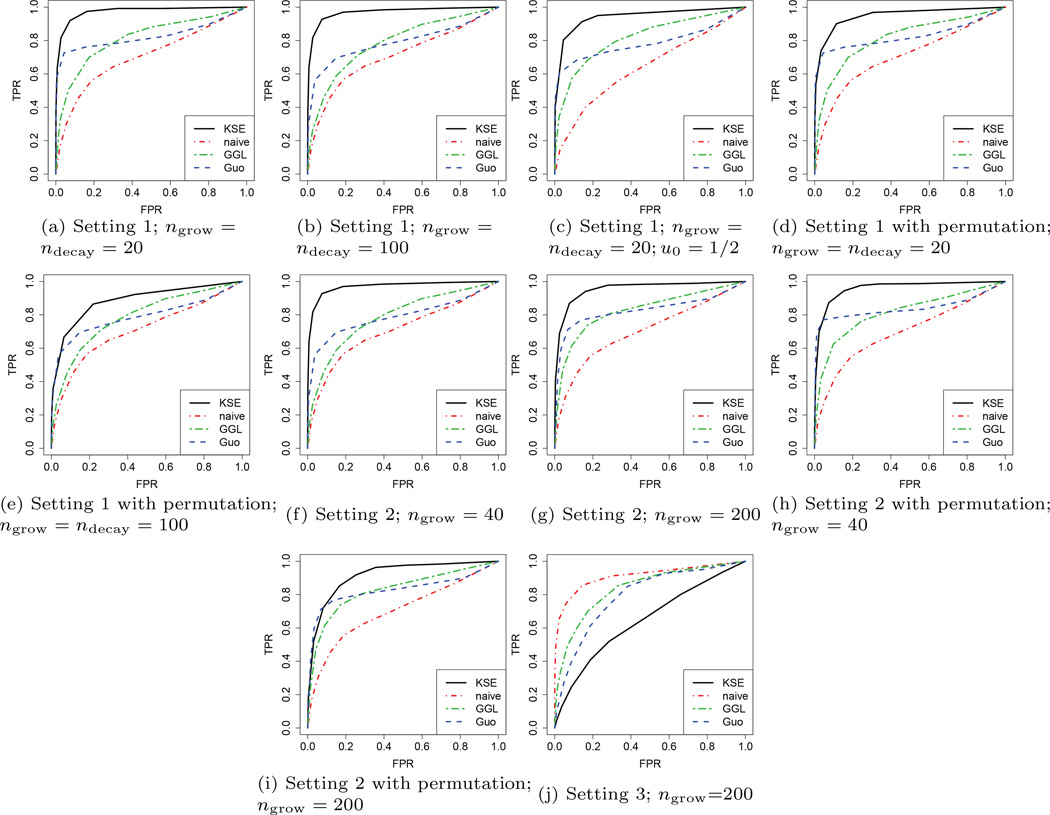
Fig. 1.
ROC curves of four competing methods under three settings: simultaneous (a–e), sequential (f–i), and random (j). The target labels are u0 = 0 except for in (c), where u0 = 1/2. In each setting we set the dimension d = 50, the number of labels n = 51, the number of observations T = 100, and the result is obtained by 1,000 simulations.

