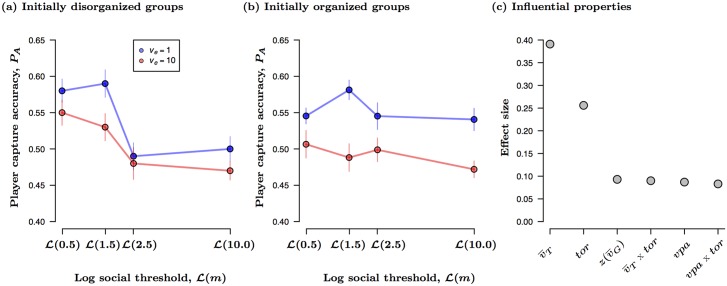
Fig 3. Effect of prey social threshold (m), target escape speed (ve), and the initial organization of the group (ρ0) on player capture accuracy, PA.
All data points in (a) and (b) show mean ± SE, corrected for repeated measures. All prey share the same social threshold (e.g., m = mT = mG) whose values were transformed as in Fig 2. Figure (c) shows the relative effect size for each of the underlying individual and group level properties that significantly influenced PA (S3 Table).

