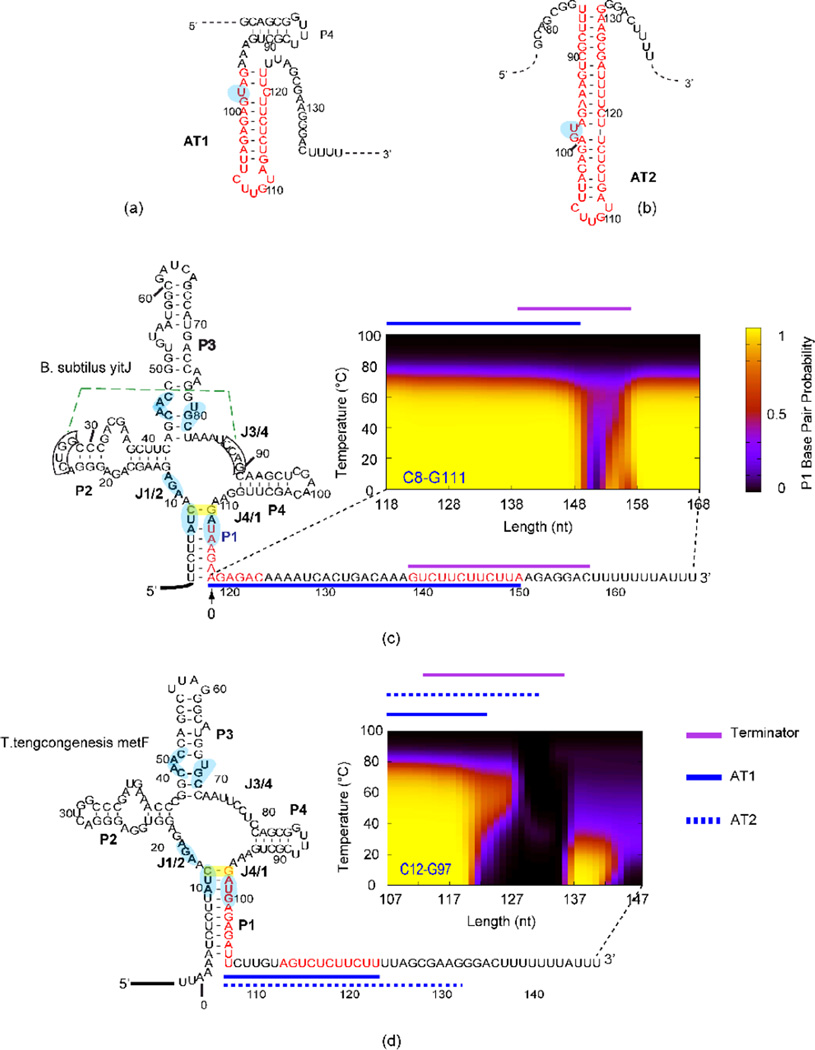
Figure 1. Alternative AT helix models and results from SAM-I riboswitches.
(a) AT1 model as proposed in reference65, in which the P4 helical region can still form the secondary structure as observed in the crystal structure of the aptamer. (b) AT2 model as suggested in reference46 and this study. Note that the P4 helix of the aptamer is disrupted when this AT2 helix is formed.. Different patterns of secondary structure competition are predicted and observed for B. subtilisyitJ (c) and T. tengcongensismetF (d) SAM-1 riboswitches. Sequence of B. subtilisyitJ and T. tengcongensismetF SAM-I riboswitches in the secondary structure representation of the “OFF” state are shown at the left. The segments highlighted in red display the residues participating in the AT helix as proposed in the literature. BPP is plotted for the closing C8•G111 base pair of the P1 helix (highlighted with a yellow box) for transcripts with varying 3’ truncations (similar BPP patterns are predicted for other base pairs in the P1 helix-shown in SI Figure 2). The horizontals plots the length increment with 0 starting at the 3’ end of the aptamer, the vertical axis shows the temperature (0–100 °C). The color scale represents the magnitude of the BPP as indicated in the legend on the right of panel c. Lines above the plots are color coded for the different structural elements (Terminator, AT1 and AT2) as indicated in the legend next to panel d. Boxed residues participate in a pseudoknot interaction (dotted green line). Residues that contact SAM according to X-ray structures are highlighted in light blue. Side by side representations of models for ON and OFF state secondary structures for both riboswitches are presented in SI Figure 1a and b.

