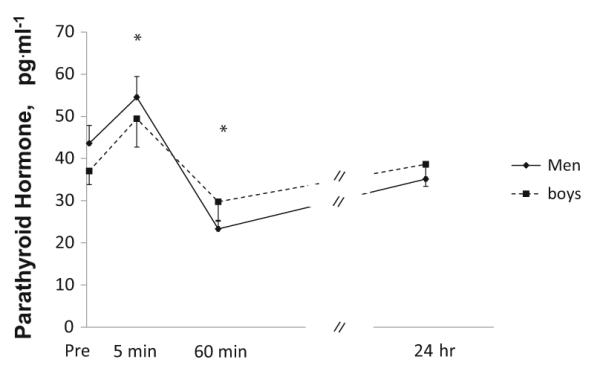
Fig. 2.

Parathyroid concentrations at baseline (immediately prior to exercise) and post-exercise (5 min, 1 h, and 24 h) in boys and men. Values are expressed as mean±SE. *Significantly different from baseline in both groups (time effect)

Parathyroid concentrations at baseline (immediately prior to exercise) and post-exercise (5 min, 1 h, and 24 h) in boys and men. Values are expressed as mean±SE. *Significantly different from baseline in both groups (time effect)