Figure 1.
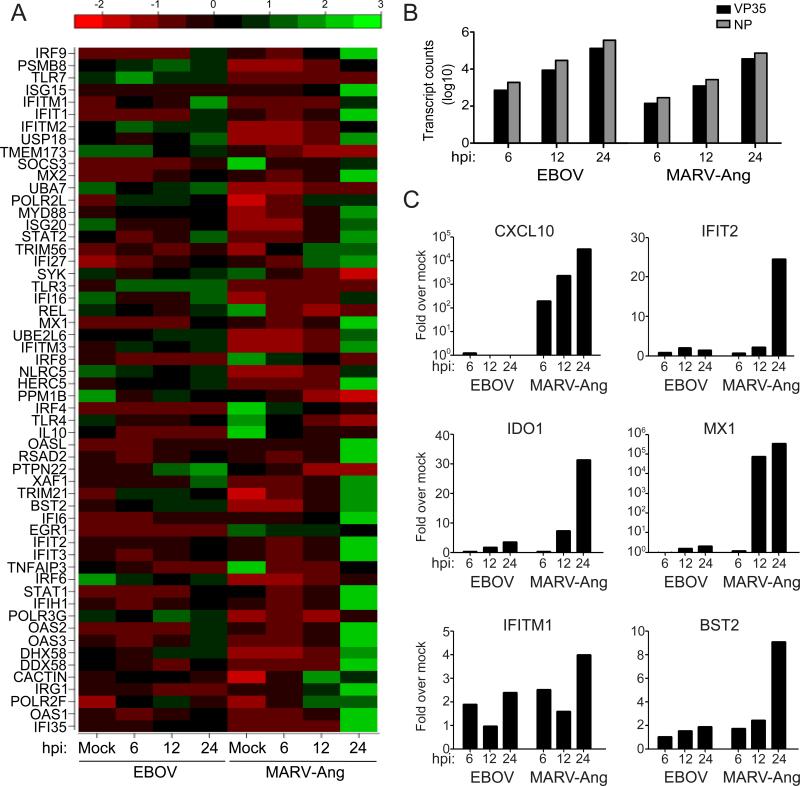
EBOV and MARV show differential expression of IFN-regulated genes. (A-C) THP-1 cells were either mock-infected or infected with EBOV or MARV-Ang at an MOI of 3. (A) RNA from infected THP-1 cells was subjected to expression analysis by mRNA deep sequencing (mRNA-seq). The heatmap displays the expression profile of IFN response genes at 6, 12, and 24 hpi. The expression levels have been normalized to account for varying library sizes. These have been scaled and centered, with green indicating larger number of transcripts and red fewer transcripts. (B) Filoviral VP35 and NP mRNA expression levels represented in terms of transcript counts. (C) Expression levels of 6 ISGs from EBOV and MARV-Ang infected cells were analyzed by qRT-PCR at 6, 12 and 24 hpi. Values were normalized to RPS11. The y-axis scale for CXCL10 and MX1 is log10. The y-axis scale for IFIT2, IDO1, IFITM1 and BST2 is linear.

