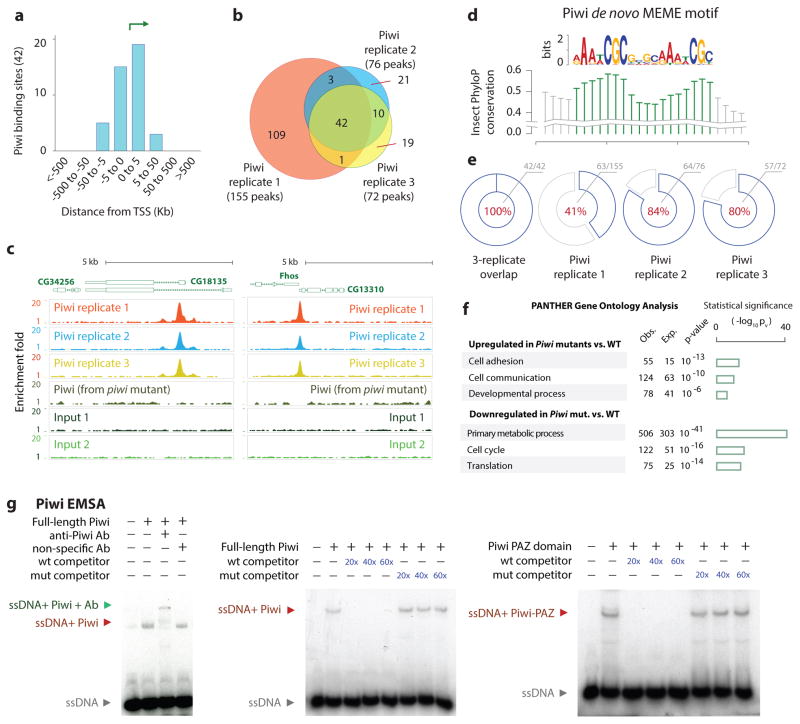
Fig. 4. Genome-wide Piwi binding patterns and Piwi EMSA.
(a) Distribution of Piwi-bound regions relative to TSS.
(b) Venn diagram showing overlaps between the triplicates of Piwi ChIP-Seq peaks.
(c) Representative Piwi binding patterns at the CG34256 and Fhos genes in wild type and piwi mutant ovaries.
(d) Sequence motif enriched within Piwi peaks identified using MEME tool. Conservation using PhyloP scores is shown.
(e) Pie charts indicate recovery of PBM within Piwi ChIP-Seq peaks: 100% (42/42) of 3-way replicated overlapping sites, 41% (63/155) in replicate 1, 84% (64/76) in replicate 2, and 80% (57/72) in replicate 3.
(f) Gene Ontology terms of the genes that were up- or down-regulated by the piwi mutations; triplicate RNA-Seq samples were used. The bar graphs representing −log of p-values.
(g) EMSA analysis of Piwi binding to the PBM in 32P-labeled oligos. Red and green arrows indicate a shift and a super-shift, respectively.

