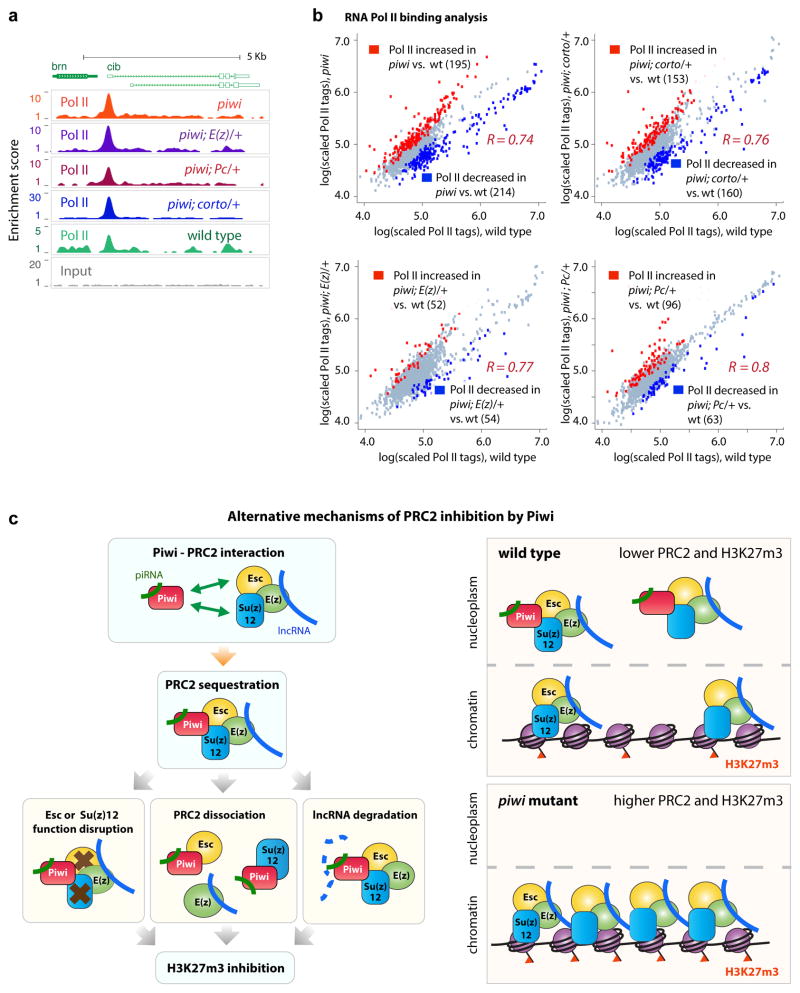
Fig. 6. RNA Pol II binding analyses in wild type and mutant ovaries.
(a) Representative Pol II binding and input signals at the cib locus.
(b) Comparisons of RNA Pol II binding intensities in four mutants vs. wild type across 1551 RNA Pol II binding regions. Each data point represents the lg-transformed average of replicate data. Pearson correlation values R between mutants and wild type strain signals were calculated. Red dots conveys increase of Z ≥ 1.5; blue for decrease of Z ≤−1.5, in mutants.
(c) PANTHER analyses of genes near RNA Pol II peaks with differential RNA Pol II levels. Obs.=observed. Exp.=expected. p-values indicate statistical significance of the enrichment.
(d) Proposed mechanisms of Piwi-mediated inhibition of PRC2. For details, see text.

