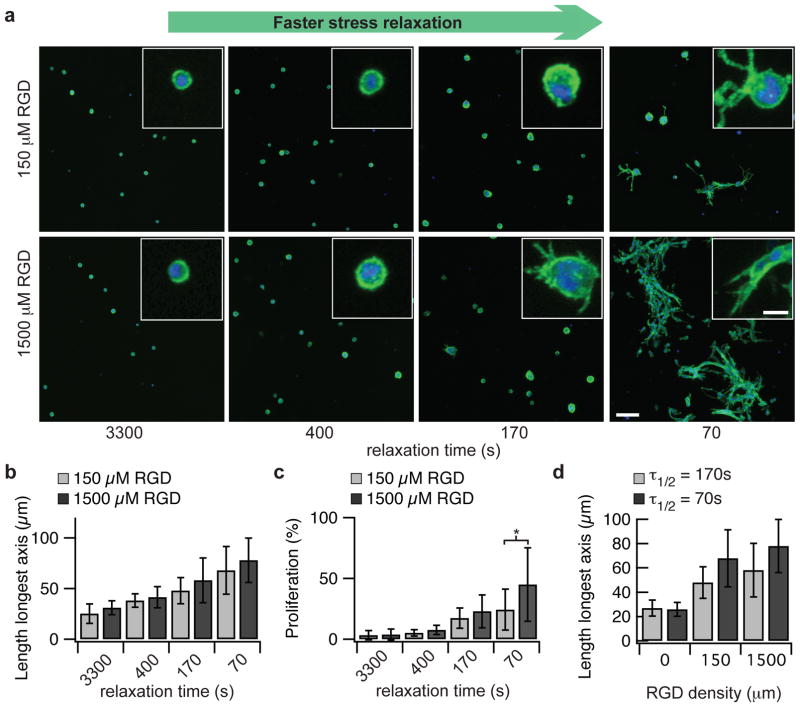
Figure 2. Cell spreading and proliferation for fibroblasts encapsulated within gels are enhanced with faster stress relaxation.
a, Representative images of 3T3 cells encapsulated within alginate gels with the indicated τ1/2 for stress relaxation and two RGD concentrations (average initial modulus of 9 kPa). Green color represents actin staining and blue represents nucleus. Images were taken after 7 days in culture. Scale bar is 100 μm for the larger image and 20 μm for the inset. b, Quantification of the longest dimension of the smallest bounding box fully containing individual 3T3 cells for the indicated conditions. ** indicates p<0.01 (student’s t-test). Spreading increases significantly with faster stress relaxation (Spearman’s rank correlation, p <0.0001 for both values of RGD). c, Quantification of proliferating cells. * indicates p<0.05 (student’s t-test). Proliferation was found to increase with faster stress relaxation (Spearman’s rank correlation, p <0.0001 for both values of RGD). d, Quantification of the longest dimension of the smallest bounding box fully containing individual 3T3 cells as a function of RGD density in alginate gels with a relaxation time of 70 or 170 seconds. Spreading increases significantly with increased RGD concentration for both gels (Spearman’s rank correlation, p <0.0001 for both values of τ1/2). Data are shown as mean +/− s.d.

