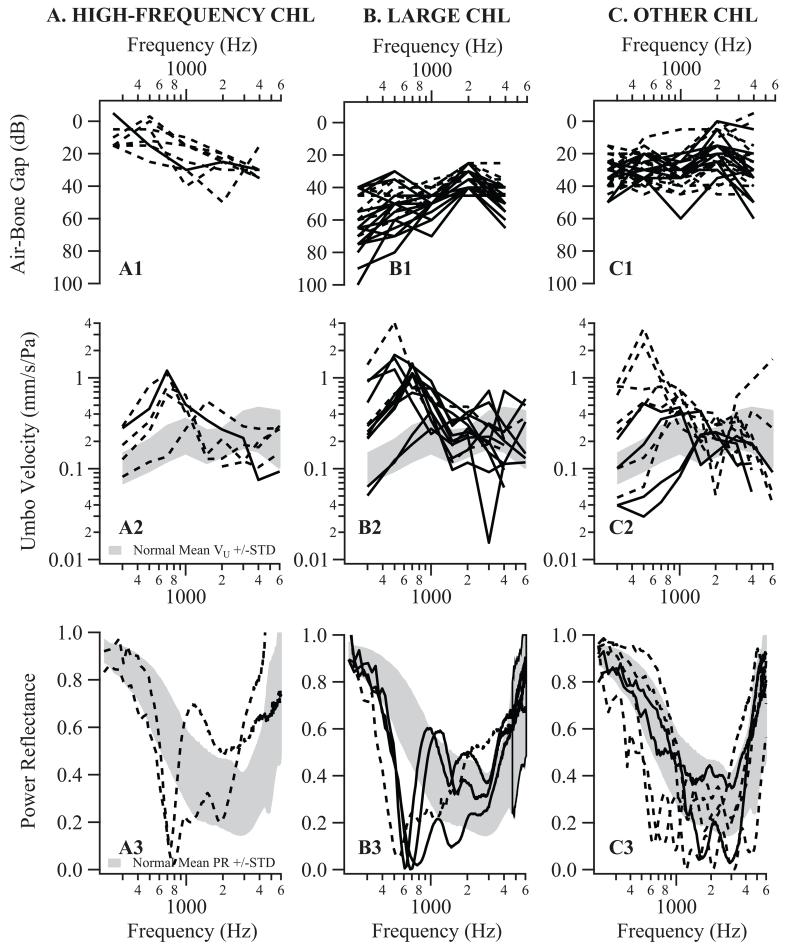
Figure 2.
Columns A, B, & C show air-bone gap, umbo velocity, and power reflectance results for individual patients grouped by CHL patterns. In these columns, dashed lines represent patients categorized as surgical partial discontinuity per the criteria detailed under “Methods”; solid lines represent patients categorized as surgical complete discontinuity. The gray shaded areas on the umbo velocity and power reflectance graphs represent normative data +/− one standard deviation around the normal mean.

