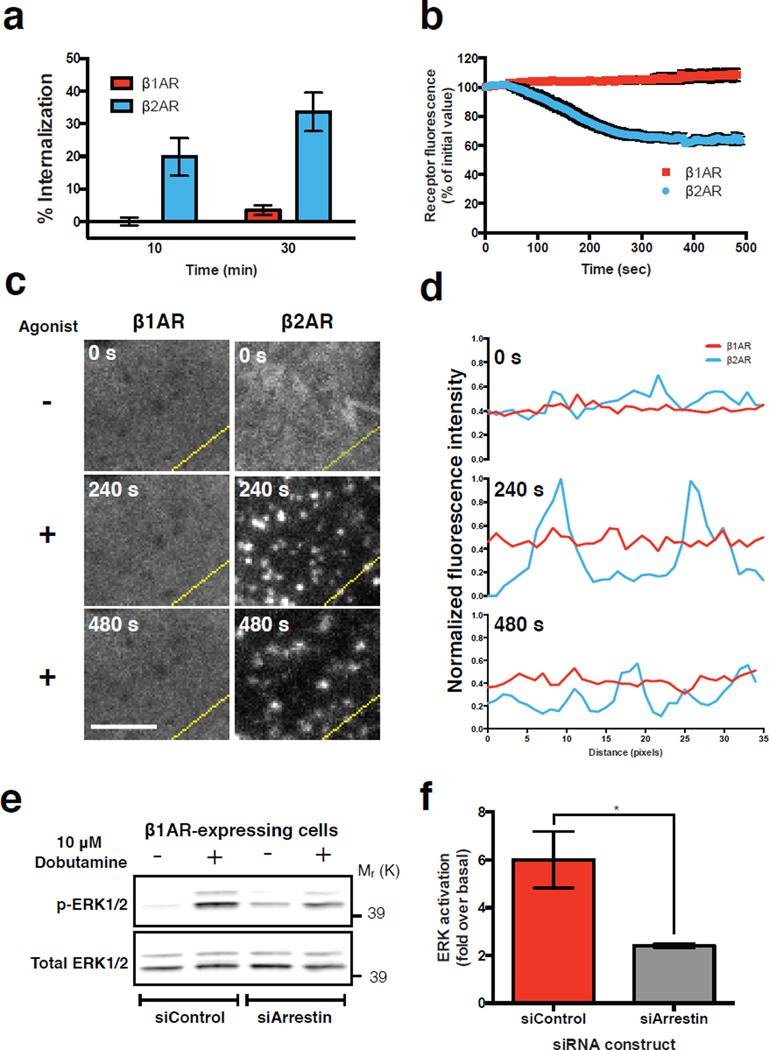
Figure 1. β1ARs do not cluster or internalize but initiate β-arrestin-2 -dependent activation of ERK1/2.
(a) Flow cytometric analysis of FLAG-tagged receptor internalization after exposure of cells to 10 μM isoproterenol for 10 or 30 min (n = 3 independent experiments; 30,000 cells per experiment). (b) Average surface receptor fluorescence after 10 μM isoproterenol treatment in TIR-FM live cell images. (n = 11 cells pooled across 3 independent experiments) (c) Frames of a representative area of cells expressing FLAG-tagged receptors and imaged live with TIR-FM at the indicated time after agonist addition. Scale bar = 5 μm. (d) Fluorescence intensity profiles of FLAG-tagged receptors from lines shown in (c). (e-f) ERK1/2 activation in β1AR-expressing cells. (e) Representative western blot of total and phosphorylated ERK1/2 after 5 minutes of agonist treatment in cells with siRNA treatment as indicated. (f) Quantification of ERK1/2 activation by normalizing phosphorylated ERK1/2 to total ERK1/2 and determining fold over untreated (n = 3 independent experiments, * p = 0.0386 by two-tailed t-test). Error bars correspond to SEM. Raw data of independent repeats are in Supplementary Table 1. Panels c, d, and e show results that are representative from 3 independent experiments. Uncropped western blot scans are shown in Supplementary Fig. 6.

