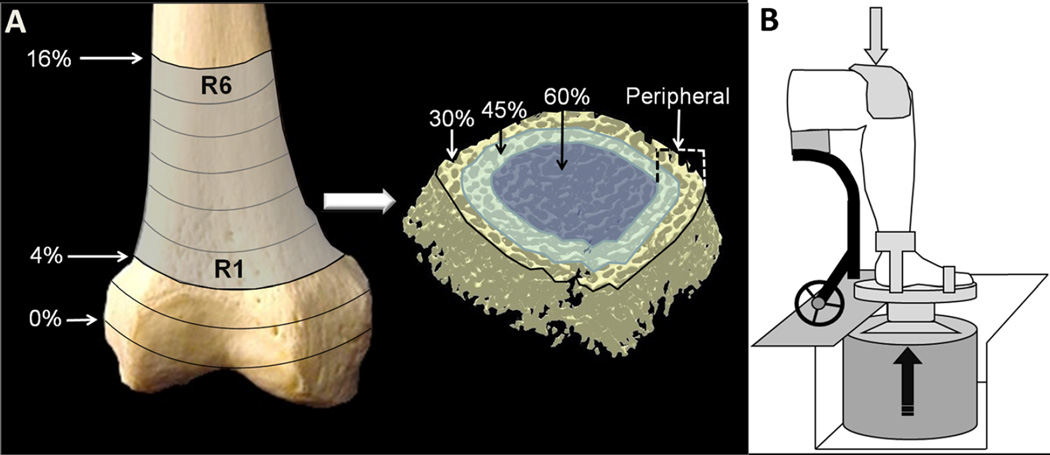
Fig. 1.
a Schematic representation of the computed tomography (CT) image-processing technique. For both the distal femur and the distal tibia, we analyzed six regions that spanned 4–16 % of the bone length (R1–R6). Each region was then processed with three concentric peel modes which removed external voxels corresponding to 30, 45, and 60 % of the region’s cross-sectional area. The final peel mode (peripheral) analyzed the outermost ring of trabecular bone by subtracting the area delineated by the 60 % peel from the area delineated by the 30 % peel. Bone mineral density (BMD) and five trabecular architecture parameters were calculated for each peel mode for each bone region. b Schematic representation of the vibration training system. Ankle and forefoot straps secured the foot to the vibrating surface. To securely couple the limb segment to the vibrating surface, a compressive load of 10–15%of body weight was applied to the top of the knee via a full-contact pad. Technical details of the vibration system have been described elsewhere [19, 30, 31]

