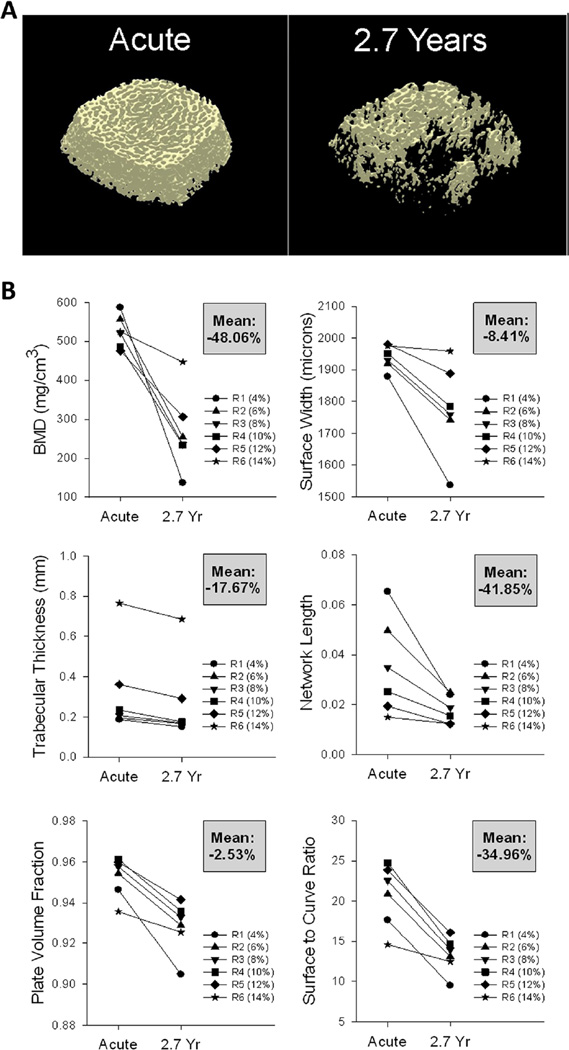
Fig. 4.
Computed tomography (CT) data for a participant followed longitudinally from acute to chronic spinal cord injury (SCI) (2.7 years). a Representative examples of CT images (30 % peel) from the right distal tibia. b Bone mineral density (BMD) and trabecular architecture values for each CT region (R1–R6). The mean percent change across time for all regions is shown in the gray box for each panel

