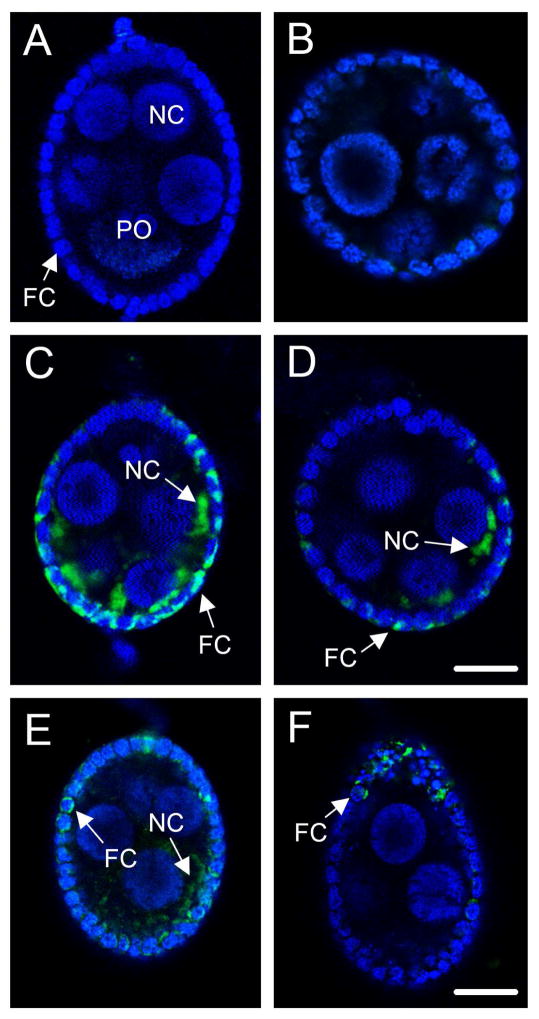
Fig. 3.
The indicator Fluo-3, AM visualizes Ca+2 influx into primary follicles following exposure to ionomycin (2.5 μM), OEH (330 nM), or ILP3 (400 nM). (A) A primary follicle preloaded with Fluo-3, AM and counterstained with nuclear dye Hoechst 33342 from an ovary cultured Ca2+-free saline (2 mM EGTA). All nuclei are labeled blue by Hoechst 33342. The nucleus of the primary oocyte (PO) is indicated as is the nucleus of a representative nurse (NC) and follicle cell (FC). No fluorescence of Fluo-3, AM (green) indicative of Ca2+ binding is visible. (B) A primary follicle from an ovary treated with 10 mM CaCl2. Hoechst labeling of cell nuclei and the absence of Fluo-3, AM fluorescence is identical to (A). (C and D) Two representative primary follicles from ovaries treated with 10 mM CaCl2 plus ionomycin. Arrows identify increased fluorescence of Fluo-3, AM (green) in the cytoplasm of a follicle (FC) and nurse cell (NC). Numerous follicle cells with increased Fluo-3, AM fluorescence are also visible. Magnification of A–D is identical with the scale bar in D equaling 48 μm. (E) A primary follicle from an ovary treated with 10 mM CaCl2 plus OEH. (F) A primary follicle from an ovary treated with 10 mM CaCl2 plus ILP3. Arrows identify increased fluorescence of Fluo-3, AM (green) in a follicle (FC) and nurse cell (NC) but also note that fewer cells exhibit a signal than in C and D. Magnification of E and F is identical with the scale bar in F equaling 96 μm.

