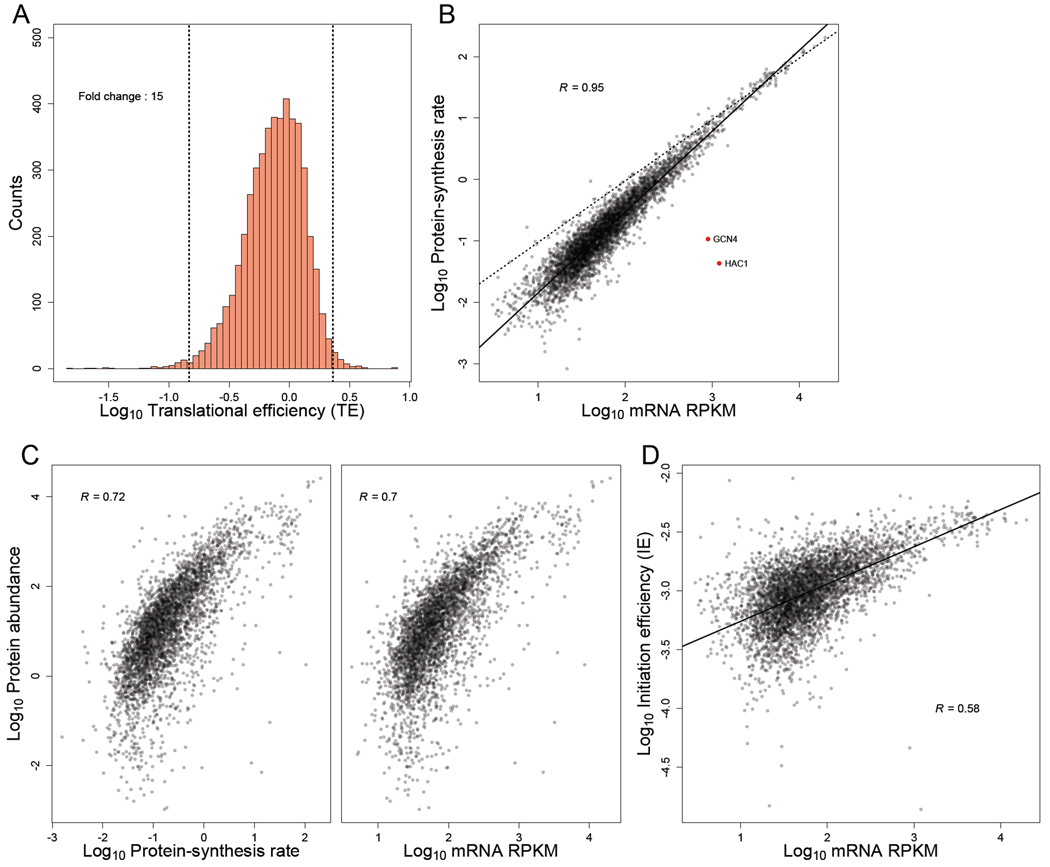
Figure 5. TEs and IEs span a narrow range in log-phase yeast cells.
(A) Distribution of TE measurements, with vertical dashed lines marking the 1st and 99th percentiles, and the fold-change separating these percentiles indicated. All ORFs with at least 128 total reads between the ribosome-profiling and RNA-seq datasets were included (except YCR024C-B, which was excluded because it is likely the 3' UTR of PMP1 rather than an independently transcribed gene).
(B) Relationship between estimated protein-synthesis rate and mRNA abundance for genes shown in (A). GCN4 and HAC1 (red points) were the only abundant mRNAs with exceptionally low protein-synthesis rates. The best linear least-squares fit to the data is shown (solid line), with the Pearson R. For reference, a one-to-one relationship between protein-synthesis rate and mRNA abundance is also shown (dashed line).
(C) Relationship between with experimentally measured protein abundance (de Godoy et al., 2008) and either (left) or mRNA abundance (right). The 3,845 genes from (A) for which protein-abundance measurements were available were included in these analyses. Pearson correlations are shown (R).
(D) Relationship between mRNA abundance and IE for genes shown in (A). The best linear least-squares fit to the data is shown, with the Pearson R.
See also Figures S8–9 and Table S5.

