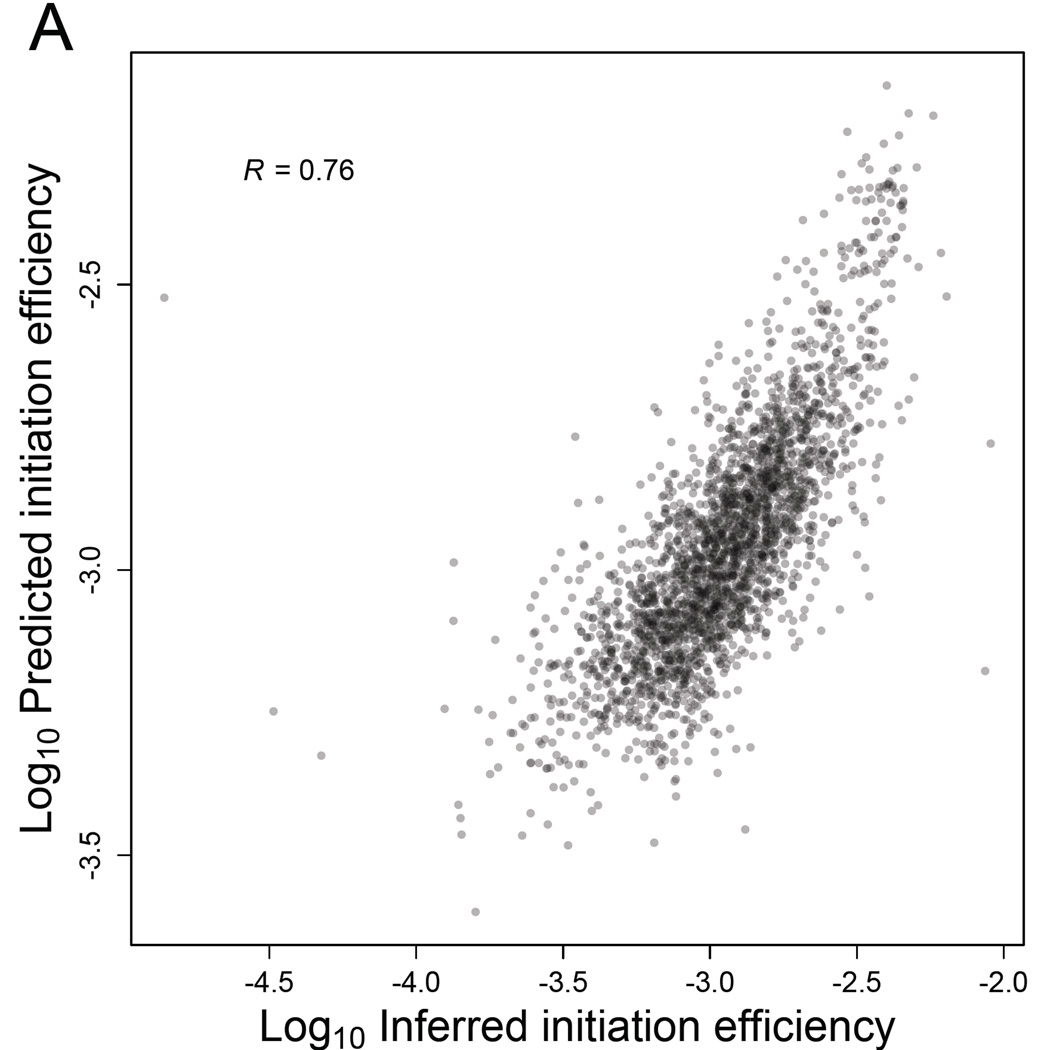
Figure 7. Sequence-based features of mRNAs largely explain yeast IEs.
(A) Correspondence between predicted IEs and IEs inferred directly from the RPF and RNA-seq data. Initiation efficiencies were predicted using a multiple-regression model, based on mRNA abundance and sequence-based features of the 2549 genes with empirically determined 5'-UTRs. Shown is the Pearson R.
See also Table S6.

