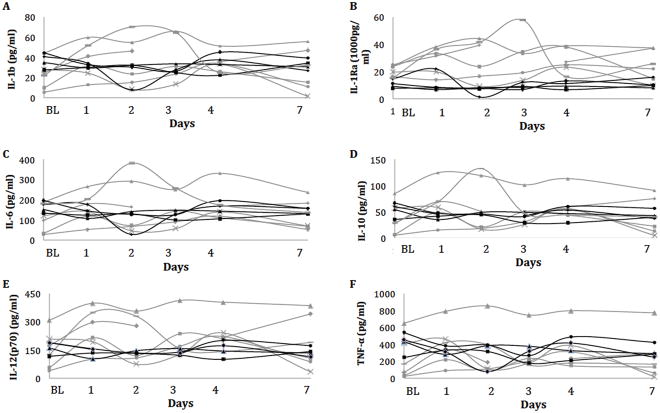
Figure 2.
Tear concentration of IL-1β (A), 1Ra (B), 6 (C), 10 (D), 12(p70) (E) and TNF-α (F) over time after contact lens removal measured using the custom Multiplex assays. Y-axis: Tear cytokine concentrations in pg/ml; X-axis: Days after contact lens removal. BL: Baseline, days following contact lenses removal. Grey lines shows subjects analysed with kit 1; black lines shows subjects analysed with kit 2.

