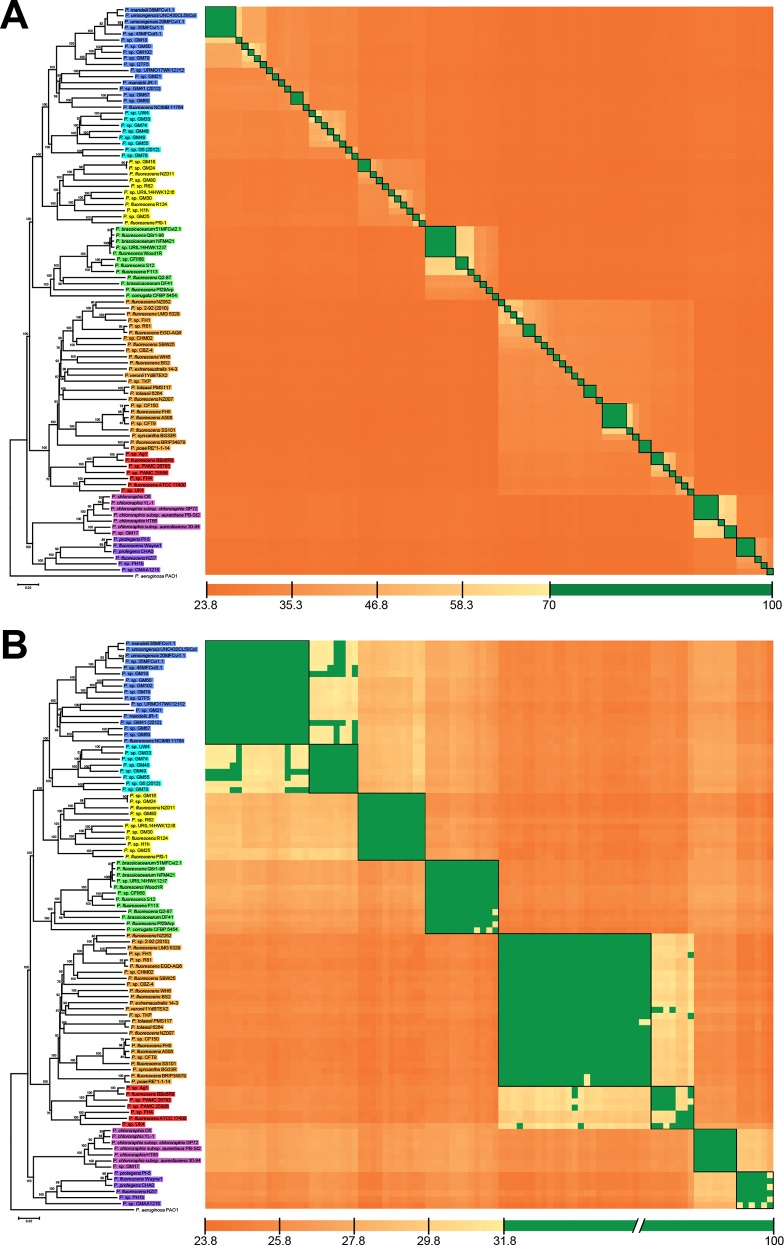
Fig 4. Heatmap of reciprocal dDDH values under species and groups thresholds.
(A) Species-level clusters at a dDDH threshold of 70% and (B) group-level clusters at 31.8% dDDH threshold. The phylogenomic tree from Fig 3B was used for ordering strains in the symmetric matrix. Black boxes on the heatmap matrix represent species or group clusters according to the OPTSIL results.

