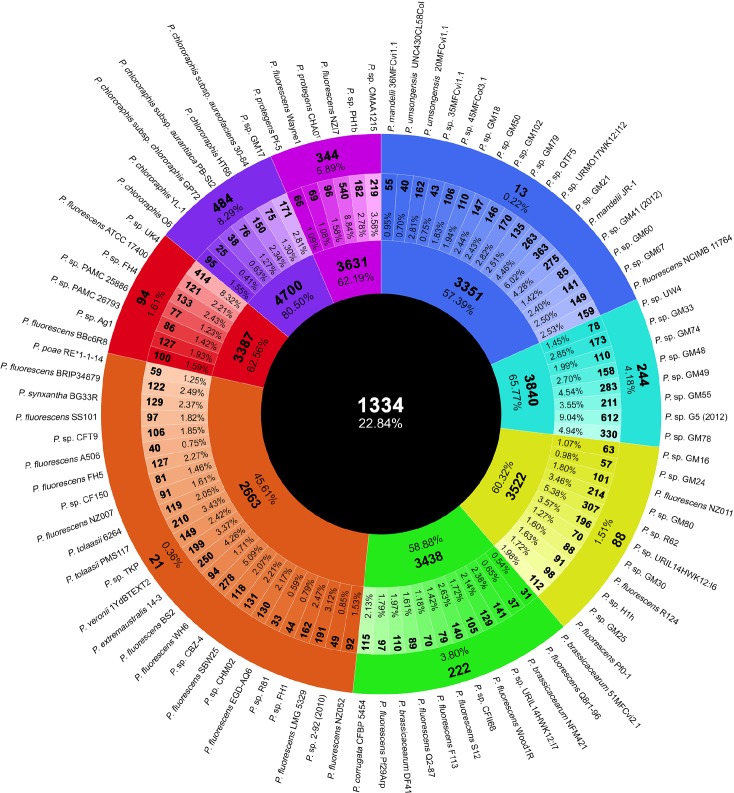
Fig 6. Number and percentages of orthologous CDSs belonging to the core, strain-specific and group-specific genome.
From outside to inside, the outer most circle shows the strain names of the P. fluorescens complex used in this work. The second circle represents the number of group-specific orthologous CDSs (bold) and the percentage it represents from the average of CDSs in all the genomes. The third circle indicates the strain-specific number of CDSs (bold) and its percentage relative to the total number of CDSs from each strain. The fourth circle represents the number of CDSs (bold) in the core-genome of each group and its percentage of the average number of CDSs in all the genomes. The fifth circle represents the core-genome CDSs of the P. fluorescens complex and their percentages of the average number of CDSs in all the genomes. Coloring is according to the groups established in this work.

