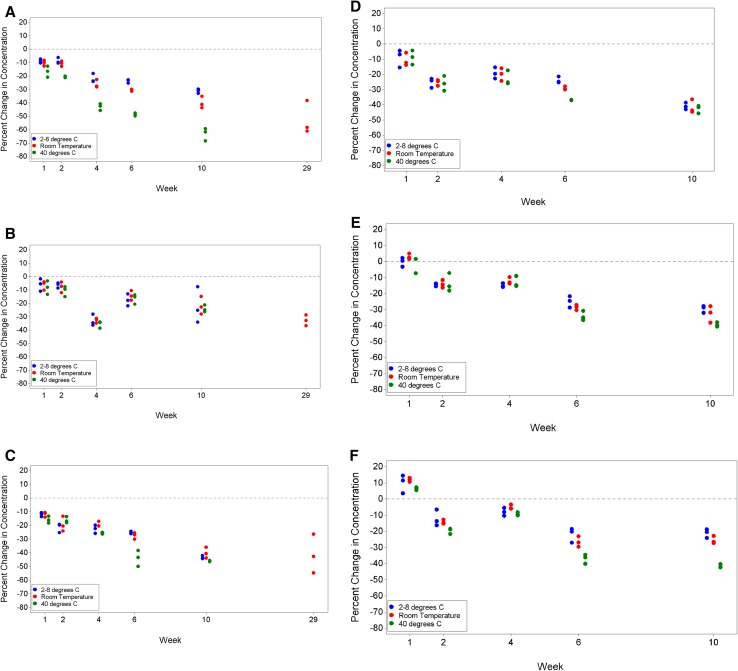
Fig. 3.
The concentration of DMTS in the liquid phase declines over time. Shown is a graph of the percent change in DMTS concentration over time as determined by GC-MS for each formulation: formulation A (panel a), formulation B (panel b), formulation C (panel c), formulation B5 (panel d), formulation B7 (panel e), and formulation B9 (panel f). For each formation, sample percent changes from triplicate samples for each week at each temperature condition are plotted. DMTS dimethyl trisulfide

