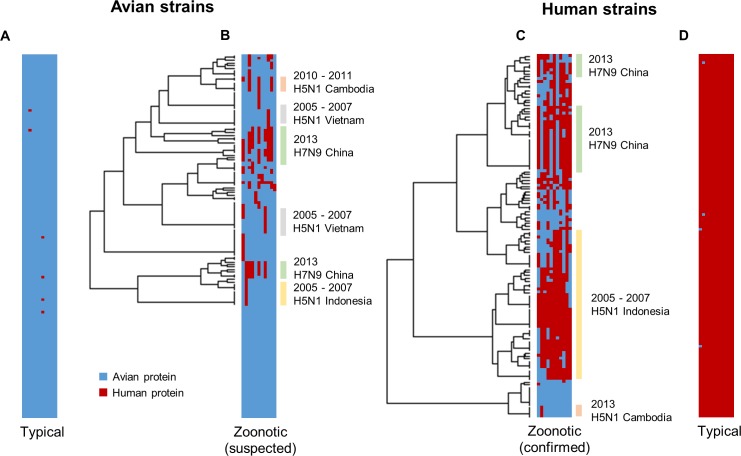
Fig 1. Host tropism protein signatures of avian, human and zoonotic strains.
Each row in the bar represents a strain, with 11 columns depicting one of each protein prediction (HA, M1, M2, NA, NP, NS1, NS2, PA, PB1, PB1-F2, and PB2). Blue column indicates an avian protein prediction while red column indicates a human protein prediction. Only a total of 146 strains are shown in each bar to match the low number of samples in confirmed zoonotic strains, with the complete result landscape illustrated in S1 Fig. (A) Typical avian strains show almost exclusive avian predictions. (B) Suspected zoonotic strains isolated from avian species during zoonotic outbreaks show slight mosaic patterns of mixed avian and human predictions. (C) Confirmed zoonotic strains isolated from human patients during zoonotic outbreaks display prominent mosaic patterns. (D) Typical human strains with almost exclusive human predictions. Hierarchical clustering shows that zoonotic strains from the same outbreaks tend to have similar signatures, with the bars indicating strains from the zoonotic outbreaks.

