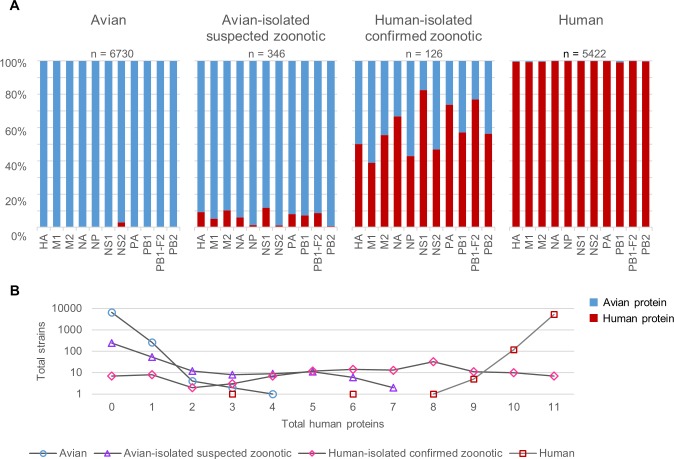
Fig 2. Percentage predictions and total number of human proteins for avian, human and zoonotic strains.
(A) 100% stacked bars representing total avian and human predictions for each protein in each group. (B) Total number of human proteins in the host tropism protein signatures of each group. A logarithmic scale of base 10 was applied to total samples.

