
Figure 3.
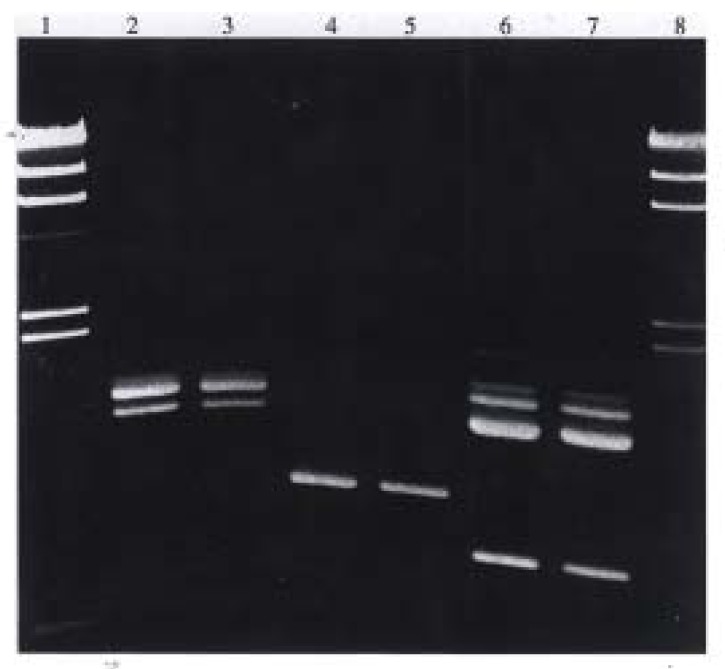
Comparison of DNA profiles of transformants and parent strains by RAPD. PCR products were run on 1% agarose gel. Strains H13, H41 and H43 were metronidazole sensitive. Lanes 1 & 8. λ DNA digested with Hind III. Lanes 2 & 3. H13 and its transformant. Lanes 4 & 5. H41 & its transformant. Lanes 6 & 7. H43 and its transformant.