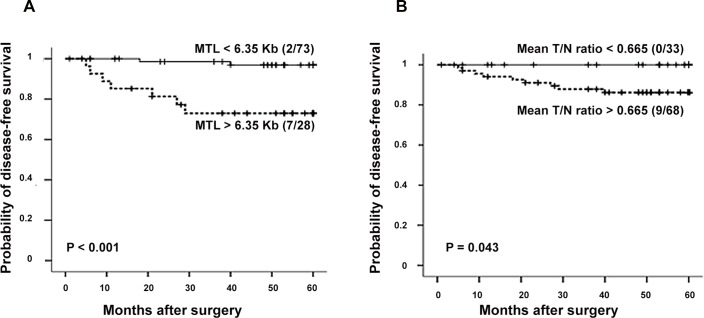
Fig 2. Kaplan-Meier survival curves considering telomere status in CRC population.
(A) Kaplan-Meier survival curves in relation to the mean telomere length (MTL). (B) Kaplan-Meier survival curves in relation to the T/N ratio. Numbers in brackets represent cases with tumour recurrence and crosses indicate censored data.

