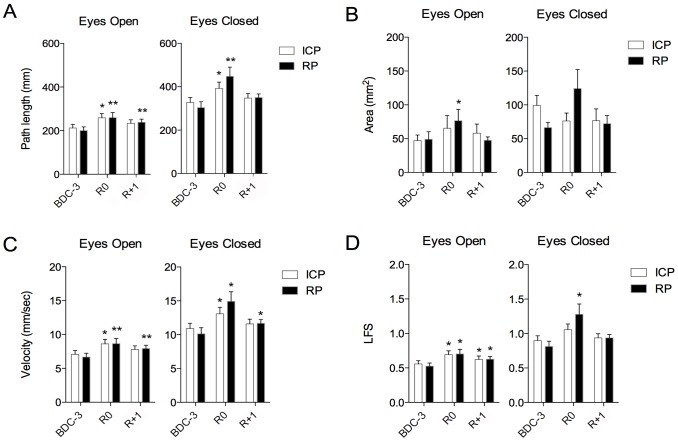
Fig 3. Mean ± SE values of postural parameters.
Mean and standard error values of center of pressure (COP) path length (A), area (B), velocity (C), and length function of surface (LFS) (D) during control period (BDC-3), the first day (R0) and the second day of recovery period (R+1) for the different test conditions: dental intercuspidal position (ICP) (white bars) and mandibular rest position (RP) (black bars), eyes open and eyes closed. * and ** significant differences compared with BDC-3 value. (Respectively p < 0.05 and p < 0.01; ANOVA for repeated measures).

