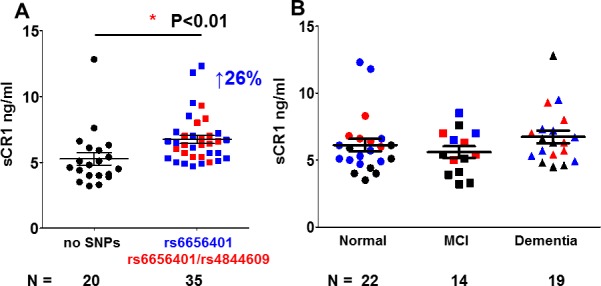
Fig 8. Soluble CR1 concentration (ng/ml) in plasma from donors with different CR1 SNPs and diagnosis.

Soluble CR1 was measured by ELISA and plotted vs. A. SNP [rs6656401 only (n = 21) or rs6656401 and rs4844609 (n = 16) and without the rs6656401 and rs4844609 SNPs (n = 22)] or B. categorized by diagnosis [nondemented (n = 22),), MCI (n = 14) and AD (n = 19)]. Recombinant CR1 was used to generate the standard curve. Black symbols indicate samples with no variant SNP (rs6656401 and rs4844609), red reflects donors with two SNPs, and blue is donors with rs6656401 only. Data points are from multiple experiments in which samples were run in triplicate and normalized to standard CR1 samples across experiments.
