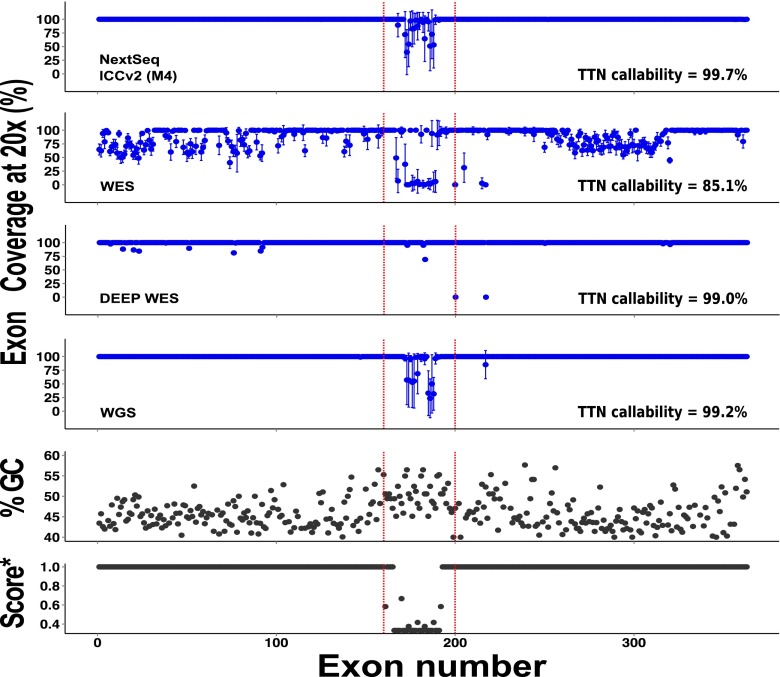
Fig. 2.
Percentage coverage of all TTN exons (ENST00000589042/NM_001267550.1) at 20× read depth across methods (top four panels). Mappability score (score* [28]) and GC content in the TTN gene (bottom two panels). Error bars represent standard deviation

