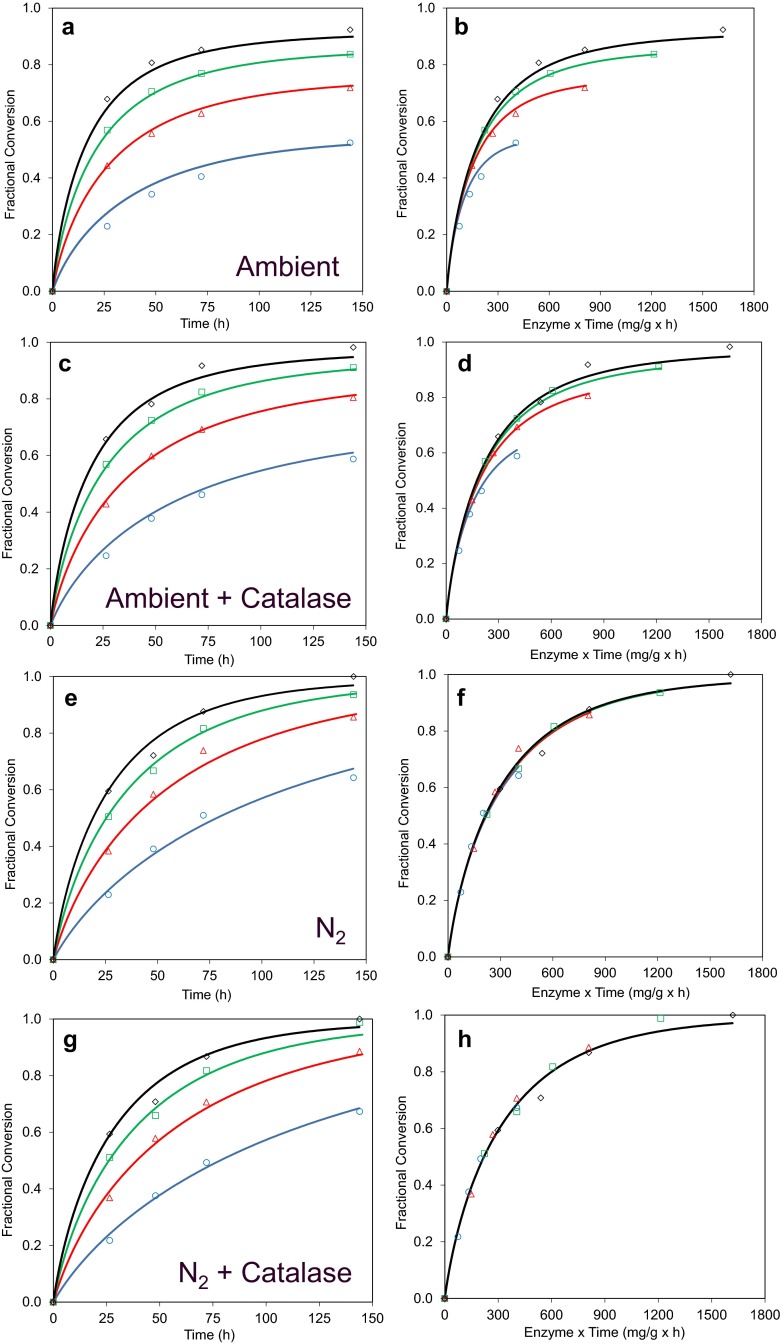
Fig. 2.
Effects of O2 limitation and catalase addition on CTec3 cellulose hydrolysis progress curves. Pretreated wheat straw was incubated with 2.8 (blue circles), 5.6 (red triangles), 8.4 (green squares) and 11.2 mg protein/g cellulose (black diamonds) of CTec3 for 144 h at 50 °C, pH 5. Reactions were carried out in ambient air (panels a and c) and O2-deprived (panels e and g) conditions. Similarly, the effects of adding catalase under each of these conditions are shown in panels c and g, respectively. To better illustrate time-dependent enzyme inactivation under each of these conditions, the conversion data are plotted as a function of enzyme dose x time in panels b, d, f and h. Model fits to these data are shown by lines colour-matched to the data

