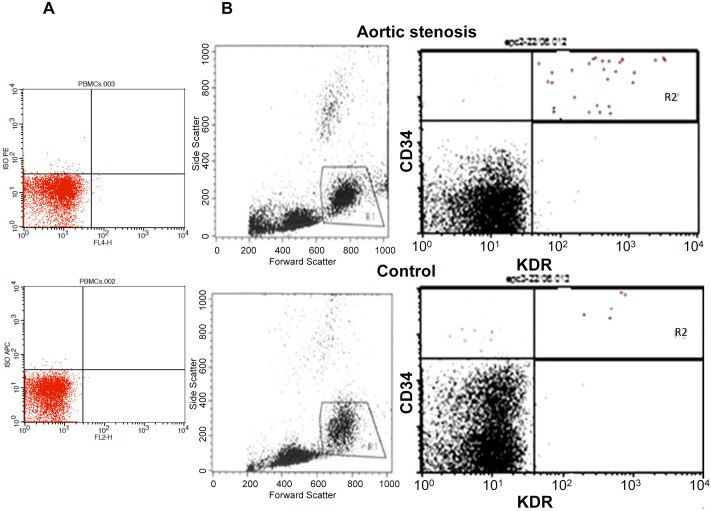
Fig 2. FACS analysis of circulating EPCs in patients with aortic valve stenosis (AS) and controls.
A. Isotope control; B. A representative example of a FACS analysis for the quantification of CD34+/KDR+ cells in patient with AS and patient with no AS is shown. R1, viable cells; R2, cells positive for CD34 and KDR.

