
Figure 5.
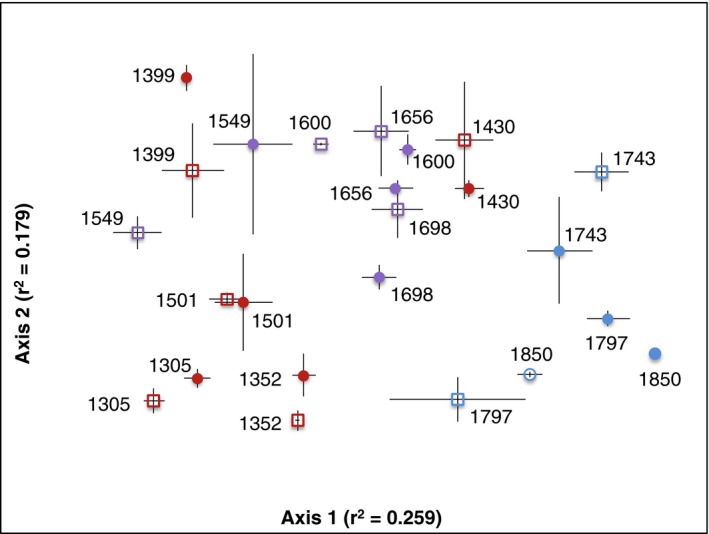
Compositional differences in fungal communities with elevation, as a NMS (nonmetric multidimensional scaling) plot. Fungal communities differed significantly with elevation (Table 1); r 2 values represent the correlation between the ordination axes and our data. Numbers adjacent to symbols indicate elevation. Open squares signify dry season samples, and closed circles signify wet season samples. Symbols are means ± SE of three replicates. Data are colored by life zone, including premontane forest (red), lower montane forest (purple), and montane forest (blue) representing low, mid‐, and higher elevation sites.