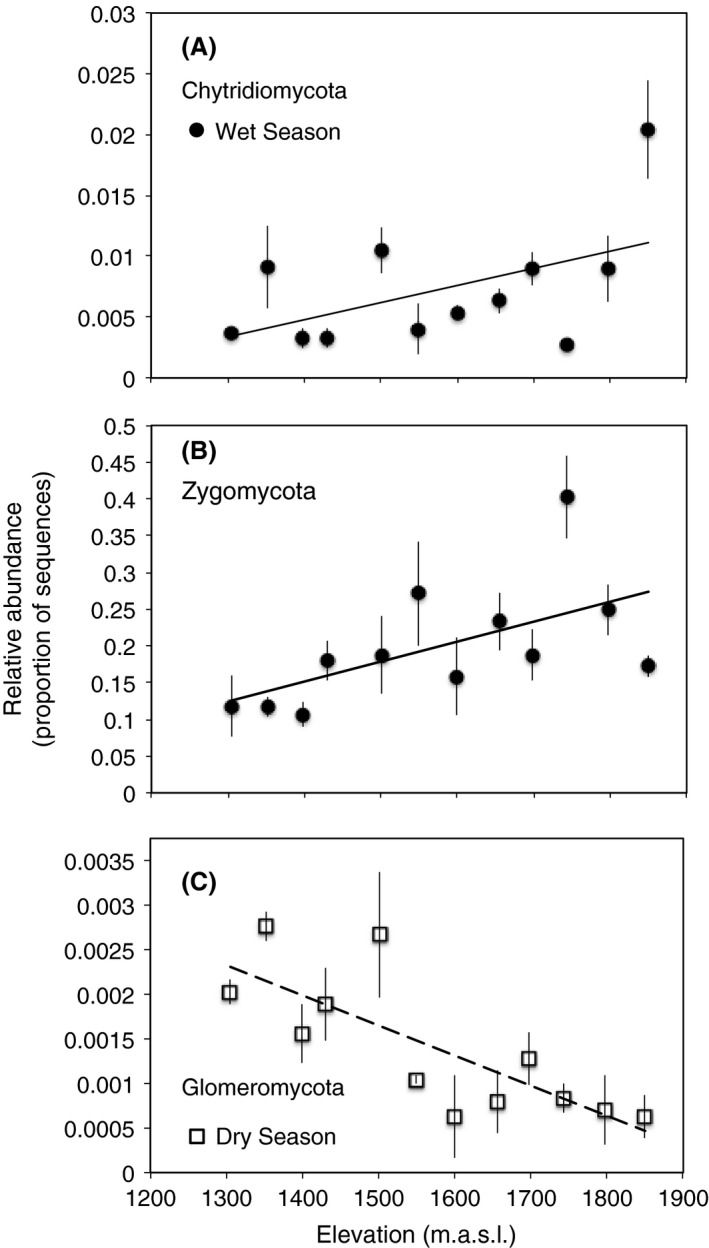
Figure 6.

Relative abundance of (A) Chytridiomycota and (B) Zygomycota with elevation during the wet (●) season and (C) Glomeromycota during the dry (□) season. Lines are significant best‐fit regressions for wet (solid line) or dry (dashed line). Symbols represent mean ± SE (n = 3). Chytridiomycota and Zygomycota data were ranked to ensure that outliers were not solely driving relationships. Relative abundance of other phyla and statistical results are presented in Table S4.
