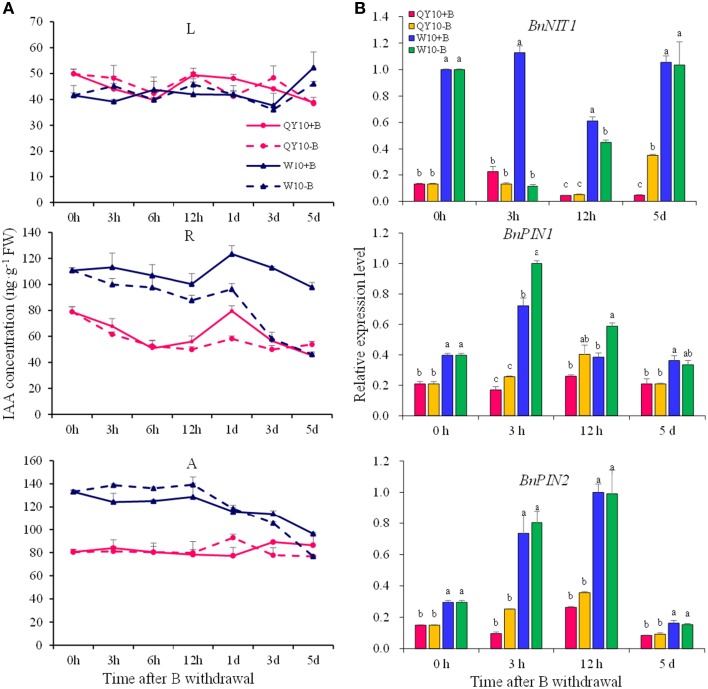
Figure 4.
IAA concentration and related-gene expression of ‘QY10’ and ‘W10’ under B-free starvation. (A) IAA concentration. (B) IAA related-gene expression in root. After been grown hydroponically under sufficient B (+B, 25 μM B) for 12 days, half of the plants were transplanted to B-free solution (−B) and then sampled at different time points, and the other plants, which served as the control, were grown continuously with sufficient B. L, leaves; R, root; A, shoot apex. Values represent the mean ± SD of four independent replicates, and bars with different letters show significant differences for the same time among the treatments (ANOVA, LSD, p < 0.05).

